U.S. Compression Therapy Market Size, Share, Growth, Trends, Statistics Analysis Report and By Segment Forecasts 2024 to 2033

Market Overview

The US compression therapy market is a rapidly growing segment within the broader medical device industry, focused on providing effective treatment solutions for various venous and lymphatic disorders. Compression therapy involves the application of controlled pressure to the affected areas of the body, primarily the legs, to improve blood flow, reduce swelling, and promote healing.

Compression therapy products, including compression stockings, bandages, and pumps, are widely used in the management of conditions such as venous leg ulcers, lymphedema, deep vein thrombosis (DVT), and varicose veins. These products play a crucial role in preventing complications, improving patient comfort, and enhancing overall quality of life for individuals suffering from these conditions.

The US compression therapy market is driven by the increasing prevalence of chronic venous disorders, the rising incidence of obesity and other risk factors, and the growing awareness among healthcare professionals and patients about the benefits of compression therapy. Additionally, the market is supported by advancements in product design, materials, and manufacturing processes, leading to improved patient comfort and compliance.
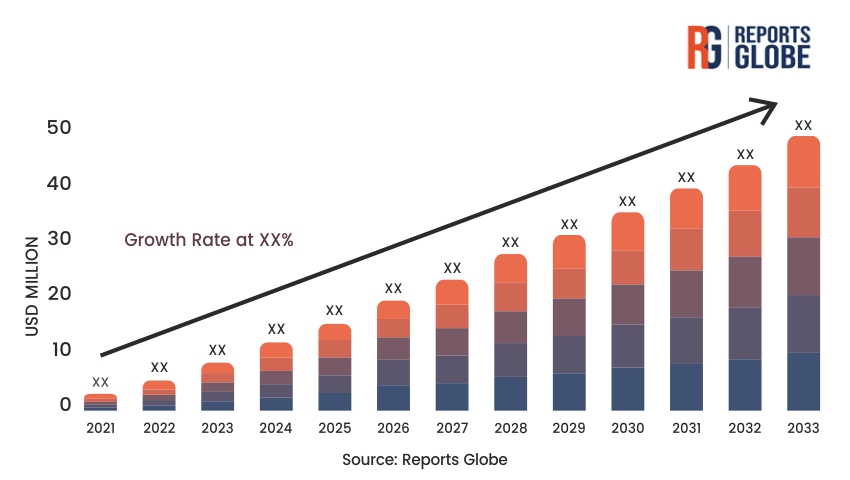
Key Takeaways of the market

  • The US compression therapy market is expected to witness significant growth due to the increasing prevalence of chronic venous disorders, the aging population, and the rising demand for effective treatment options.
  • Compression stockings and bandages are the dominant product categories, offering varying levels of compression and materials to address specific patient needs.
  • The market is driven by the rising incidence of obesity, sedentary lifestyles, and the growing burden of risk factors contributing to venous disorders.
  • The high cost of advanced compression therapy products and potential reimbursement challenges may pose barriers to market growth and adoption in certain segments.
  • Technological advancements, such as the development of smart compression devices and wearable monitoring systems, present opportunities for improved patient compliance and better treatment outcomes.

Market Driver

One of the primary drivers of the US compression therapy market is the increasing prevalence of chronic venous disorders, such as venous leg ulcers and lymphedema. According to the Society for Vascular Surgery, approximately 2.4 million Americans suffer from chronic venous insufficiency, while lymphedema affects an estimated 3 to 5 million people in the United States.

Furthermore, the rising incidence of obesity and other risk factors, including sedentary lifestyles, diabetes, and advanced age, has contributed to the growing demand for compression therapy products. Obesity is a significant risk factor for venous disorders, as excess weight can increase pressure on the veins and impair circulation.

Additionally, the aging population in the US is another driving force behind the compression therapy market. As individuals age, the risk of developing venous disorders increases due to various factors, such as decreased mobility, weakened valves in the veins, and underlying medical conditions.

Market Restraint

Despite the growing demand for compression therapy products, the US market faces several restraints that may hinder its growth. One of the primary challenges is the high cost associated with advanced compression therapy devices and products. While basic compression stockings and bandages are relatively affordable, specialized compression pumps and customized garments can be expensive, posing a financial burden for patients without adequate insurance coverage or limited financial resources.

Additionally, reimbursement challenges and varying coverage policies across different insurance providers can pose a barrier to market growth and adoption of compression therapy products. Inconsistent reimbursement policies or limited coverage for certain products may limit patient access and discourage healthcare providers from recommending these treatments.

Furthermore, the potential for poor patient compliance and adherence to compression therapy regimens can also be a restraint. Some patients may find compression garments uncomfortable or inconvenient, leading to reduced compliance and potentially compromising treatment outcomes.

Market Opportunity

The US compression therapy market presents several opportunities for growth and innovation. One area of opportunity lies in the development of smart compression devices and wearable monitoring systems. These advanced technologies can provide real-time data on compression levels, patient adherence, and treatment progress, enabling healthcare professionals to make informed decisions and adjust treatment plans accordingly.

Another opportunity exists in the development of customized compression therapy solutions tailored to specific patient needs and body types. By leveraging advanced manufacturing techniques and 3D scanning technologies, manufacturers can create compression garments and devices that offer improved fit, comfort, and efficacy for individual patients.

The integration of digital technologies, such as telemedicine and remote patient monitoring, also presents an opportunity for market growth. These technologies can facilitate virtual consultations, remote monitoring of treatment progress, and improved communication between healthcare providers and patients, ultimately leading to better patient compliance and outcomes.

Furthermore, the expansion of compression therapy applications beyond traditional venous disorders, such as in the management of post-surgical swelling or sports-related injuries, can open new avenues for market growth and product innovation.

Market Segment Analysis

  1. By Product Type

The compression therapy market can be segmented based on the type of product offered. The two main categories are:

  1. a) Compression Stockings and Bandages: This segment includes a wide range of compression garments, such as stockings, socks, and bandages, designed to provide varying levels of compression and support for the legs and other affected areas. These products are available in different materials, compression levels, and styles to accommodate various patient needs and preferences.
  2. b) Compression Pumps: Compression pumps are advanced devices that deliver intermittent or sequential compression to the affected areas, promoting blood flow and reducing swelling. These pumps can be used in combination with compression garments or as standalone devices, depending on the specific treatment requirements.
  1. By Application

The compression therapy market can also be segmented based on the specific applications for which the products are used. The primary applications include:

  1. a) Venous Leg Ulcers: Compression therapy is widely used in the management of venous leg ulcers, which are chronic wounds caused by poor venous circulation. Compression stockings and bandages help improve blood flow, reduce swelling, and promote healing of these ulcers.
  2. b) Lymphedema: Compression therapy is an essential component in the treatment of lymphedema, a condition characterized by the accumulation of lymphatic fluid in the affected areas, typically the arms or legs. Compression garments and pumps help manage swelling and prevent further complications.

Regional Analysis

The US compression therapy market is influenced by regional variations in factors such as the prevalence of venous disorders, healthcare infrastructure, and reimbursement policies. Traditionally, regions with higher concentrations of healthcare facilities, specialized vascular clinics, and an aging population have witnessed greater demand for compression therapy products.

States like California, Texas, and Florida have been leading the market due to their large populations, the presence of renowned medical centers and healthcare facilities, and the high incidence of venous disorders and associated risk factors, such as obesity and diabetes.

Additionally, regions with a higher concentration of skilled healthcare professionals, such as vascular surgeons, wound care specialists, and physical therapists, have experienced increased adoption of compression therapy products. These regions often have well-established treatment protocols and guidelines, facilitating the appropriate use of compression therapy for various venous and lymphatic conditions.

However, the market growth in certain regions may be hindered by challenges related to reimbursement policies and access to specialized healthcare services. Rural areas or regions with limited access to advanced healthcare facilities may face barriers in adopting advanced compression therapy products and achieving optimal treatment outcomes.

Competitive Analysis

The US compression therapy market is highly competitive, with several major players offering a range of products and technologies. These players compete on various fronts, including product innovation, pricing strategies, and distribution networks.

Major players in the US compression therapy market include:

  1. Essity (formerly SCA Hygiene Products): Essity is a leading player in the compression therapy market, offering a range of compression stockings and bandages under brands like JOBST and Venosan.
  2. 3M Company: 3M is a prominent player in the medical devices industry, offering compression therapy products like the Coban 2 Compression System and the 3M Coban 2 Lite Compression System.
  3. Medi GmbH & Co. KG: Medi is a German company with a strong presence in the US compression therapy market, offering products like the mediven and Circaid compression garments and bandages.
  4. Sigvaris: Sigvaris is a Swiss company specializing in compression therapy solutions, including a wide range of compression stockings and socks for various applications.
  5. BSN Medical: BSN Medical is a global provider of medical products, offering compression therapy solutions like the Jobst FarrowWrap and Jobst OppreSor compression garments.

These key players invest heavily in research and development to introduce innovative compression therapy products, incorporating advanced materials, improved designs, and enhanced comfort features. They also focus on expanding their distribution networks, forming strategic partnerships, and offering comprehensive patient education and support services.

Key Industry Developments

  • Development of smart compression devices and wearable monitoring systems for real-time data tracking and improved patient adherence.
  • Introduction of customized compression therapy solutions tailored to individual patient needs and body types, leveraging advanced manufacturing techniques and 3D scanning technologies.
  • Integration of digital technologies, such as telemedicine and remote patient monitoring, to enhance patient care and improve treatment outcomes.
  • Expansion of compression therapy applications beyond traditional venous disorders, such as in the management of post-surgical swelling or sports-related injuries.
  • Increasing focus on sustainable and eco-friendly materials in the manufacturing of compression therapy products.
  • Adoption of advanced knitting and weaving technologies to improve the comfort, breathability, and durability of compression garments.

Future Outlook

The future outlook for the US compression therapy market remains positive, with continued growth anticipated in the coming years. The increasing prevalence of chronic venous disorders, driven by the aging population and the rising incidence of obesity and other risk factors, will continue to fuel the demand for effective compression therapy solutions.

Technological advancements in the development of smart compression devices, wearable monitoring systems, and customized compression therapy products are expected to enhance patient compliance, improve treatment outcomes, and drive market growth. These innovations will enable healthcare professionals to tailor treatment plans based on real-time data and individual patient needs, leading to more personalized and effective care.

However, the market will also face challenges related to the high cost of advanced compression therapy products and potential reimbursement barriers. Addressing these challenges through innovative pricing strategies, collaborations with insurance providers, and advocacy efforts will be crucial to ensure widespread access and affordability for patients in need.

Furthermore, the integration of digital technologies, such as telemedicine and remote patient monitoring, will likely play a significant role in optimizing the use of compression therapy and enhancing patient care. These technologies can facilitate virtual consultations, remote monitoring of treatment progress, and improved communication between healthcare providers and patients, ultimately leading to better patient outcomes.

Overall, the US compression therapy market is poised for growth, driven by the increasing demand for effective treatment solutions, technological advancements, and a growing emphasis on improving patient quality of life for those affected by venous and lymphatic disorders.

Market Segmentation

  • By Product Type
    • Compression Stockings and Bandages
    • Compression Pumps
    • Compression Garments (Sleeves, Wraps, etc.)
  • By Application
    • Venous Leg Ulcers
    • Lymphedema
    • Deep Vein Thrombosis (DVT)
    • Varicose Veins
    • Other Applications
  • By Compression Level
    • Low Compression (15-20 mmHg)
    • Moderate Compression (20-30 mmHg)
    • High Compression (30-40 mmHg)
    • Extra-High Compression (Above 40 mmHg)
  • By End-User
    • Hospitals and Clinics
    • Home Healthcare
    • Skilled Nursing Facilities
    • Ambulatory Surgical Centers
  • By Region
    • Northeast
    • Midwest
    • South
    • West
  • By Distribution Channel
    • Direct Sales
    • Distributors
    • Online Channels
  • By Material
    • Cotton
    • Nylon
    • Spandex
    • Other Materials


Table of Contents

Chapter 1. Research Methodology & Data Sources

1.1. Data Analysis Models
1.2. Research Scope & Assumptions
1.3. List of Primary & Secondary Data Sources 

Chapter 2. Executive Summary

2.1. Market Overview
2.2. Segment Overview
2.3. Market Size and Estimates, 2021 to 2033
2.4. Market Size and Estimates, By Segments, 2021 to 2033

Chapter 3. Industry Analysis

3.1. Market Segmentation
3.2. Market Definitions and Assumptions
3.3. Supply chain analysis
3.4. Porter’s five forces analysis
3.5. PEST analysis
3.6. Market Dynamics
3.6.1. Market Driver Analysis
3.6.2. Market Restraint analysis
3.6.3. Market Opportunity Analysis
3.7. Competitive Positioning Analysis, 2023
3.8. Key Player Ranking, 2023

Chapter 4. Market Segment Analysis- Segment 1

4.1.1. Historic Market Data & Future Forecasts, 2024-2033
4.1.2. Historic Market Data & Future Forecasts by Region, 2024-2033

Chapter 5. Market Segment Analysis- Segment 2

5.1.1. Historic Market Data & Future Forecasts, 2024-2033
5.1.2. Historic Market Data & Future Forecasts by Region, 2024-2033

Chapter 6. Regional or Country Market Insights

** Reports focusing on a particular region or country will contain data unique to that region or country **

6.1. Global Market Data & Future Forecasts, By Region 2024-2033

6.2. North America
6.2.1. Historic Market Data & Future Forecasts, 2024-2033
6.2.2. Historic Market Data & Future Forecasts, By Segment 1, 2024-2033
6.2.3. Historic Market Data & Future Forecasts, By Segment 2, 2024-2033

6.2.4. U.S.
6.2.4.1. Historic Market Data & Future Forecasts, 2024-2033
6.2.4.2. Historic Market Data & Future Forecasts, By Segment 1, 2024-2033
6.2.4.3. Historic Market Data & Future Forecasts, By Segment 2, 2024-2033

6.2.5. Canada
6.2.5.1. Historic Market Data & Future Forecasts, 2024-2033
6.2.5.2. Historic Market Data & Future Forecasts, By Segment 1, 2024-2033
6.2.5.3. Historic Market Data & Future Forecasts, By Segment 2, 2024-2033

6.3. Europe
6.3.1. Historic Market Data & Future Forecasts, 2024-2033
6.3.2. Historic Market Data & Future Forecasts, By Segment 1, 2024-2033
6.3.3. Historic Market Data & Future Forecasts, By Segment 2, 2024-2033

6.3.4. UK
6.3.4.1. Historic Market Data & Future Forecasts, 2024-2033
6.3.4.2. Historic Market Data & Future Forecasts, By Segment 1, 2024-2033
6.3.4.3. Historic Market Data & Future Forecasts, By Segment 2, 2024-2033

6.3.5. Germany
6.3.5.1. Historic Market Data & Future Forecasts, 2024-2033
6.3.5.2. Historic Market Data & Future Forecasts, By Segment 1, 2024-2033
6.3.5.3. Historic Market Data & Future Forecasts, By Segment 2, 2024-2033

6.3.6. France
6.3.6.1. Historic Market Data & Future Forecasts, 2024-2033
6.3.6.2. Historic Market Data & Future Forecasts, By Segment 1, 2024-2033
6.3.6.3. Historic Market Data & Future Forecasts, By Segment 2, 2024-2033

6.4. Asia Pacific
6.4.1. Historic Market Data & Future Forecasts, 2024-2033
6.4.2. Historic Market Data & Future Forecasts, By Segment 1, 2024-2033
6.4.3. Historic Market Data & Future Forecasts, By Segment 2, 2024-2033

6.4.4. China
6.4.4.1. Historic Market Data & Future Forecasts, 2024-2033
6.4.4.2. Historic Market Data & Future Forecasts, By Segment 1, 2024-2033
6.4.4.3. Historic Market Data & Future Forecasts, By Segment 2, 2024-2033

6.4.5. India
6.4.5.1. Historic Market Data & Future Forecasts, 2024-2033
6.4.5.2. Historic Market Data & Future Forecasts, By Segment 1, 2024-2033
6.4.5.3. Historic Market Data & Future Forecasts, By Segment 2, 2024-2033

6.4.6. Japan
6.4.6.1. Historic Market Data & Future Forecasts, 2024-2033
6.4.6.2. Historic Market Data & Future Forecasts, By Segment 1, 2024-2033
6.4.6.3. Historic Market Data & Future Forecasts, By Segment 2, 2024-2033

6.4.7. South Korea
6.4.7.1. Historic Market Data & Future Forecasts, 2024-2033
6.4.7.2. Historic Market Data & Future Forecasts, By Segment 1, 2024-2033
6.4.7.3. Historic Market Data & Future Forecasts, By Segment 2, 2024-2033

6.5. Latin America
6.5.1. Historic Market Data & Future Forecasts, 2024-2033
6.5.2. Historic Market Data & Future Forecasts, By Segment 1, 2024-2033
6.5.3. Historic Market Data & Future Forecasts, By Segment 2, 2024-2033

6.5.4. Brazil
6.5.4.1. Historic Market Data & Future Forecasts, 2024-2033
6.5.4.2. Historic Market Data & Future Forecasts, By Segment 1, 2024-2033
6.5.4.3. Historic Market Data & Future Forecasts, By Segment 2, 2024-2033

6.5.5. Mexico
6.5.5.1. Historic Market Data & Future Forecasts, 2024-2033
6.5.5.2. Historic Market Data & Future Forecasts, By Segment 1, 2024-2033
6.5.5.3. Historic Market Data & Future Forecasts, By Segment 2, 2024-2033

6.6. Middle East & Africa
6.6.1. Historic Market Data & Future Forecasts, 2024-2033
6.6.2. Historic Market Data & Future Forecasts, By Segment 1, 2024-2033
6.6.3. Historic Market Data & Future Forecasts, By Segment 2, 2024-2033

6.6.4. UAE
6.6.4.1. Historic Market Data & Future Forecasts, 2024-2033
6.6.4.2. Historic Market Data & Future Forecasts, By Segment 1, 2024-2033
6.6.4.3. Historic Market Data & Future Forecasts, By Segment 2, 2024-2033

6.6.5. Saudi Arabia
6.6.5.1. Historic Market Data & Future Forecasts, 2024-2033
6.6.5.2. Historic Market Data & Future Forecasts, By Segment 1, 2024-2033
6.6.5.3. Historic Market Data & Future Forecasts, By Segment 2, 2024-2033

6.6.6. South Africa
6.6.6.1. Historic Market Data & Future Forecasts, 2024-2033
6.6.6.2. Historic Market Data & Future Forecasts, By Segment 1, 2024-2033
6.6.6.3. Historic Market Data & Future Forecasts, By Segment 2, 2024-2033

Chapter 7. Competitive Landscape

7.1. Competitive Heatmap Analysis, 2023
7.2. Competitive Product Analysis

7.3. Company 1
7.3.1. Company Description
7.3.2. Financial Highlights
7.3.3. Product Portfolio
7.3.4. Strategic Initiatives

7.4. Company 2
7.4.1. Company Description
7.4.2. Financial Highlights
7.4.3. Product Portfolio
7.4.4. Strategic Initiatives

7.5. Company 3
7.5.1. Company Description
7.5.2. Financial Highlights
7.5.3. Product Portfolio
7.5.4. Strategic Initiatives

7.6. Company 4
7.6.1. Company Description
7.6.2. Financial Highlights
7.6.3. Product Portfolio
7.6.4. Strategic Initiatives

7.7. Company 5
7.7.1. Company Description
7.7.2. Financial Highlights
7.7.3. Product Portfolio
7.7.4. Strategic Initiatives

7.8. Company 6
7.8.1. Company Description
7.8.2. Financial Highlights
7.8.3. Product Portfolio
7.8.4. Strategic Initiatives

7.9. Company 7
7.9.1. Company Description
7.9.2. Financial Highlights
7.9.3. Product Portfolio
7.9.4. Strategic Initiatives

7.10. Company 8
7.10.1. Company Description
7.10.2. Financial Highlights
7.10.3. Product Portfolio
7.10.4. Strategic Initiatives

7.11. Company 9
7.11.1. Company Description
7.11.2. Financial Highlights
7.11.3. Product Portfolio
7.11.4. Strategic Initiatives

7.12. Company 10
7.12.1. Company Description
7.12.2. Financial Highlights
7.12.3. Product Portfolio
7.12.4. Strategic Initiatives

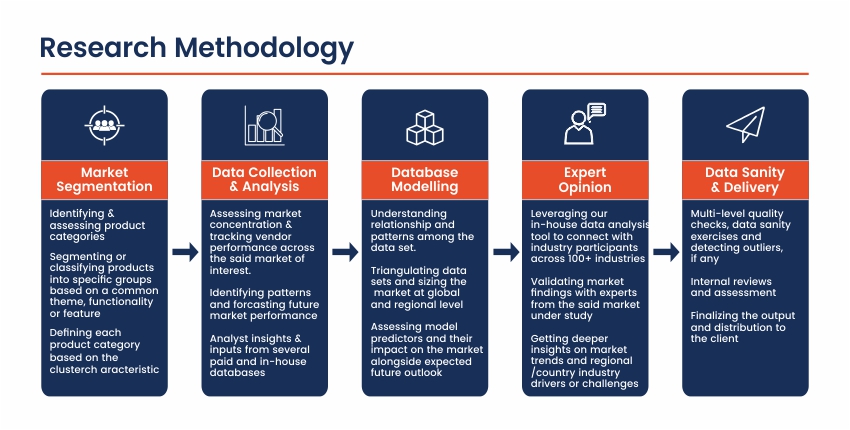
Research Methodology

Frequently Asked Questions About This Report

Choose License Type

$1,800
$2,340
$2,970

Our salient features

Best Solution

We will assist you in comprehending the value propositions of various reports across multiple domains and recommend the optimal solution to meet your research requirements.

Customized Research

Our team of analysts and consultants provide assistance for customized research requirements

Max ROI

Guaranteed maximum assistance to help you get your reports at the optimum prices, thereby ensuring maximum returns on investment.

24/7 Support

24X7 availability to help you through the buying process as well as answer any of your doubts.

Get a free sample report

This free sample study provides a comprehensive overview of the report, including an executive summary, market segments, complete analysis, country-level analysis, and more.

Our Clients

We've Received Your Request

We Thank You for filling out your requirements. Our sales team will get in touch with you shortly.