United States Computed Tomography Market Size, Share, Growth, Trends, Statistics Analysis Report and By Segment Forecasts 2024 to 2033

Market Overview

The United States Computed Tomography (CT) market is a vital component of the country’s healthcare sector, offering advanced imaging solutions for the diagnosis, monitoring, and treatment planning of various medical conditions. Computed tomography, also known as CT or CAT scanning, utilizes X-rays and computer technology to generate detailed cross-sectional images of the body, providing valuable information about internal organs, tissues, and structures. CT imaging plays a critical role in the detection and characterization of diseases such as cancer, cardiovascular disorders, neurological conditions, and musculoskeletal injuries. With continuous advancements in technology and software algorithms, CT scanners have become faster, more accurate, and capable of capturing high-resolution images with reduced radiation exposure. The market is driven by factors such as increasing prevalence of chronic diseases, growing demand for non-invasive diagnostic procedures, rising healthcare expenditure, and expanding applications of CT imaging across various medical specialties.
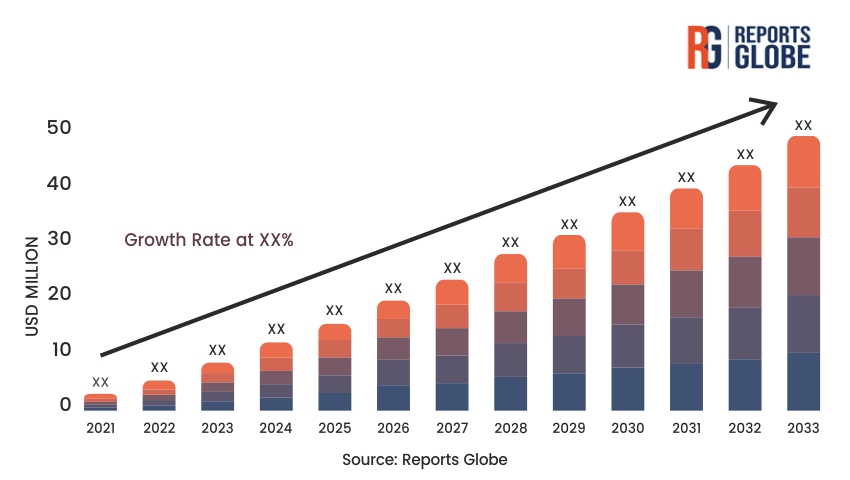
Key Takeaways of the Market

  • Growing adoption of advanced CT imaging technologies, such as multi-detector CT (MDCT), dual-energy CT (DECT), and spectral CT, enabling enhanced diagnostic capabilities and improved patient outcomes.
  • Expansion of indications and clinical applications for CT imaging beyond traditional anatomical imaging to include functional and molecular imaging techniques, such as perfusion CT, CT angiography, and CT spectroscopy.
  • Rising demand for point-of-care and portable CT scanners in emergency departments, intensive care units, and ambulatory care settings, facilitating rapid diagnosis and treatment decision-making.
  • Integration of artificial intelligence (AI) and machine learning algorithms into CT image reconstruction and interpretation software, enabling automated image analysis, quantitative assessment, and computer-aided diagnosis.
  • Increasing focus on dose optimization and radiation dose reduction strategies in CT imaging protocols, driven by concerns about patient safety, radiation exposure risks, and regulatory requirements.

Market Driver

One of the primary drivers of the United States Computed Tomography market is the increasing prevalence of chronic and lifestyle-related diseases, such as cancer, cardiovascular disorders, and neurological conditions, driving demand for advanced diagnostic imaging technologies. Computed tomography plays a crucial role in the early detection, staging, and monitoring of diseases, enabling healthcare providers to make timely and informed treatment decisions. With the aging population and rising incidence of age-related conditions, such as stroke, dementia, and osteoporosis, there is a growing need for accurate and reliable imaging modalities that can provide comprehensive anatomical and functional information to guide patient management. Moreover, technological advancements in CT scanner design, software algorithms, and image reconstruction techniques have improved image quality, resolution, and diagnostic accuracy, enhancing the clinical utility and value of CT imaging across a wide range of medical specialties.

Market Restraint

Despite the numerous benefits and applications of Computed Tomography, the market faces challenges related to cost, accessibility, and radiation dose concerns. CT scanners are high-cost capital equipment, requiring substantial investment in procurement, installation, maintenance, and ongoing operational expenses. This cost factor can limit the affordability and accessibility of CT imaging services, particularly in underserved and rural areas with limited healthcare infrastructure and resources. Moreover, concerns about radiation exposure and cumulative dose risks associated with CT imaging have prompted regulatory agencies, healthcare providers, and industry stakeholders to implement dose optimization strategies, dose monitoring protocols, and radiation dose reduction techniques. While advancements in CT scanner technology have led to significant reductions in radiation dose levels, balancing the benefits of diagnostic information with the potential risks of radiation exposure remains a critical consideration in clinical decision-making and patient management.

Market Opportunity

The United States Computed Tomography market presents significant opportunities for growth and innovation, driven by emerging trends such as precision medicine, personalized healthcare, and value-based reimbursement models. With increasing emphasis on early disease detection, targeted therapy, and patient-centered care, there is a growing demand for integrated diagnostic solutions that combine imaging, biomarker analysis, and genetic testing to tailor treatment strategies to individual patient profiles. Computed tomography, with its ability to provide detailed anatomical and functional information, is well-positioned to play a central role in this paradigm shift towards personalized medicine. Moreover, the integration of artificial intelligence (AI) and machine learning algorithms into CT image analysis software offers the potential to automate routine tasks, improve diagnostic accuracy, and enhance clinical decision support systems. By leveraging these technological advancements and addressing unmet needs in areas such as oncology, cardiology, and neurology, stakeholders in the CT market can capitalize on opportunities for product innovation, market expansion, and strategic partnerships.

Market Segment Analysis

Oncology Imaging: One of the key segments driving growth in the United States Computed Tomography market is oncology imaging, where CT scanners play a crucial role in cancer diagnosis, staging, treatment planning, and response assessment. Computed tomography offers high-resolution imaging capabilities that enable the visualization of tumors, metastases, and surrounding tissues with excellent anatomical detail. CT imaging is commonly used in conjunction with other imaging modalities such as positron emission tomography (PET), magnetic resonance imaging (MRI), and ultrasound to provide comprehensive information about tumor morphology, vascularity, and metabolic activity. With advancements in contrast agents, imaging protocols, and image processing techniques, CT scanners can provide functional and molecular information through techniques such as perfusion CT, CT angiography, and dual-energy CT (DECT). These advances enhance the sensitivity and specificity of CT imaging for tumor detection, characterization, and treatment response assessment, supporting personalized cancer care and improving patient outcomes.

Cardiovascular Imaging: Another important segment driving growth in the United States Computed Tomography market is cardiovascular imaging, where CT scanners are used for the non-invasive assessment of cardiac anatomy, function, and coronary artery disease. Computed tomography angiography (CTA) is a widely utilized imaging technique that enables the visualization of the heart and blood vessels with high spatial resolution and temporal resolution. CT imaging is particularly valuable for evaluating patients with chest pain, suspected coronary artery disease, or congenital heart abnormalities, providing detailed anatomical information about coronary artery anatomy, plaque burden, and myocardial perfusion. With advancements in CT scanner technology, such as high-definition imaging, wide-detector arrays, and rapid image acquisition, cardiac CT has become an essential tool for risk stratification, treatment planning, and follow-up in patients with cardiovascular disease. Moreover, the integration of CT imaging with computational fluid dynamics (CFD) and fractional flow reserve (FFR) analysis allows for functional assessment of coronary stenosis and hemodynamic significance, enhancing the diagnostic accuracy and clinical utility of CT angiography in the evaluation of chest pain and ischemic heart disease.

Regional Analysis

The United States Computed Tomography market is geographically diverse, with significant variations in market dynamics, healthcare infrastructure, and patient demographics across different regions. Major metropolitan areas and academic medical centers are typically equipped with advanced CT imaging facilities, offering a wide range of diagnostic and interventional services to patients. In contrast, rural and underserved regions may have limited access to CT scanners and specialized imaging services, leading to disparities in healthcare access and outcomes. Regional variations in healthcare reimbursement policies, insurance coverage, and healthcare spending also influence the adoption and utilization of CT imaging technology, with some regions experiencing higher demand for imaging services due to population demographics, disease prevalence, and healthcare provider preferences. Moreover, regulatory considerations, such as state licensing requirements, accreditation standards, and radiation safety guidelines, can impact the distribution and utilization of CT scanners across different regions.

Competitive Analysis

The United States Computed Tomography market is highly competitive, with several major players and a diverse array of manufacturers, service providers, and healthcare institutions vying for market share. Leading vendors in the market offer a comprehensive portfolio of CT imaging systems, software solutions, and support services tailored to the diverse needs and preferences of healthcare providers and patients. These companies invest heavily in research and development to innovate new technologies, improve imaging performance, and enhance user experience, driving product differentiation and competitive advantage. Moreover, strategic partnerships, collaborations, and acquisitions are common in the industry, as companies seek to expand their market presence, broaden their product offerings, and capitalize on emerging opportunities in areas such as artificial intelligence, precision medicine, and value-based healthcare. While large multinational corporations dominate the market, there is also a vibrant ecosystem of smaller players and niche providers offering specialized CT imaging solutions for specific clinical applications, patient populations, or healthcare settings. Competition in the CT market is driven by factors such as product innovation, pricing strategies, customer service, and brand reputation, as well as regulatory compliance, quality standards, and market access considerations.

Key Industry Developments

  • Introduction of next-generation CT scanners with advanced imaging capabilities, such as high-definition imaging, spectral imaging, and iterative reconstruction algorithms, enabling improved diagnostic accuracy and reduced radiation dose.
  • Integration of artificial intelligence (AI) and machine learning algorithms into CT imaging systems and software platforms for automated image analysis, computer-aided diagnosis, and clinical decision support.
  • Development of portable and point-of-care CT scanners for use in emergency departments, intensive care units, and remote healthcare settings, facilitating rapid diagnosis and treatment planning.
  • Expansion of clinical applications and indications for CT imaging beyond traditional anatomical imaging to include functional, molecular, and interventional techniques for oncology, cardiology, neurology, and orthopedics.
  • Adoption of value-based reimbursement models and payment reforms incentivizing healthcare providers to deliver high-quality, cost-effective care, driving demand for efficient and integrated diagnostic imaging solutions.

Future Outlook

The United States Computed Tomography market is poised for continued growth and innovation, fueled by advancements in technology, changing healthcare delivery models, and evolving patient needs. With the increasing emphasis on precision medicine, personalized healthcare, and population health management, there is a growing demand for integrated diagnostic solutions that combine imaging, genomics, and clinical data to tailor treatment strategies to individual patient profiles. Computed tomography, with its ability to provide detailed anatomical and functional information, is well-positioned to play a central role in this transformation of healthcare delivery. Moreover, the integration of artificial intelligence (AI) and machine learning algorithms into CT imaging systems offers the potential to automate routine tasks, improve diagnostic accuracy, and enhance clinical decision support, enabling more efficient and effective patient care. By leveraging these technological advancements and addressing unmet needs in areas such as oncology, cardiology, neurology, and emergency medicine, stakeholders in the CT market can capitalize on opportunities for growth, differentiation, and value creation in the evolving healthcare landscape.

Market Segmentation

  • By Technology:
    • Single-Source CT
    • Multi-Detector CT (MDCT)
    • Dual-Energy CT (DECT)
    • Spectral CT
    • Portable CT
    • Point-of-Care CT
  • By Application:
    • Oncology Imaging
    • Cardiovascular Imaging
    • Neurological Imaging
    • Musculoskeletal Imaging
    • Abdominal Imaging
    • Emergency and Trauma Imaging
  • By End User:
    • Hospitals
    • Diagnostic Imaging Centers
    • Ambulatory Surgery Centers
    • Emergency Departments
    • Clinics and Physician Offices
  • By Region:
    • Northeast
    • Midwest
    • South
    • West

Table of Contents

Chapter 1. Research Methodology & Data Sources

1.1. Data Analysis Models
1.2. Research Scope & Assumptions
1.3. List of Primary & Secondary Data Sources 

Chapter 2. Executive Summary

2.1. Market Overview
2.2. Segment Overview
2.3. Market Size and Estimates, 2021 to 2033
2.4. Market Size and Estimates, By Segments, 2021 to 2033

Chapter 3. Industry Analysis

3.1. Market Segmentation
3.2. Market Definitions and Assumptions
3.3. Supply chain analysis
3.4. Porter’s five forces analysis
3.5. PEST analysis
3.6. Market Dynamics
3.6.1. Market Driver Analysis
3.6.2. Market Restraint analysis
3.6.3. Market Opportunity Analysis
3.7. Competitive Positioning Analysis, 2023
3.8. Key Player Ranking, 2023

Chapter 4. Market Segment Analysis- Segment 1

4.1.1. Historic Market Data & Future Forecasts, 2024-2033
4.1.2. Historic Market Data & Future Forecasts by Region, 2024-2033

Chapter 5. Market Segment Analysis- Segment 2

5.1.1. Historic Market Data & Future Forecasts, 2024-2033
5.1.2. Historic Market Data & Future Forecasts by Region, 2024-2033

Chapter 6. Regional or Country Market Insights

** Reports focusing on a particular region or country will contain data unique to that region or country **

6.1. Global Market Data & Future Forecasts, By Region 2024-2033

6.2. North America
6.2.1. Historic Market Data & Future Forecasts, 2024-2033
6.2.2. Historic Market Data & Future Forecasts, By Segment 1, 2024-2033
6.2.3. Historic Market Data & Future Forecasts, By Segment 2, 2024-2033

6.2.4. U.S.
6.2.4.1. Historic Market Data & Future Forecasts, 2024-2033
6.2.4.2. Historic Market Data & Future Forecasts, By Segment 1, 2024-2033
6.2.4.3. Historic Market Data & Future Forecasts, By Segment 2, 2024-2033

6.2.5. Canada
6.2.5.1. Historic Market Data & Future Forecasts, 2024-2033
6.2.5.2. Historic Market Data & Future Forecasts, By Segment 1, 2024-2033
6.2.5.3. Historic Market Data & Future Forecasts, By Segment 2, 2024-2033

6.3. Europe
6.3.1. Historic Market Data & Future Forecasts, 2024-2033
6.3.2. Historic Market Data & Future Forecasts, By Segment 1, 2024-2033
6.3.3. Historic Market Data & Future Forecasts, By Segment 2, 2024-2033

6.3.4. UK
6.3.4.1. Historic Market Data & Future Forecasts, 2024-2033
6.3.4.2. Historic Market Data & Future Forecasts, By Segment 1, 2024-2033
6.3.4.3. Historic Market Data & Future Forecasts, By Segment 2, 2024-2033

6.3.5. Germany
6.3.5.1. Historic Market Data & Future Forecasts, 2024-2033
6.3.5.2. Historic Market Data & Future Forecasts, By Segment 1, 2024-2033
6.3.5.3. Historic Market Data & Future Forecasts, By Segment 2, 2024-2033

6.3.6. France
6.3.6.1. Historic Market Data & Future Forecasts, 2024-2033
6.3.6.2. Historic Market Data & Future Forecasts, By Segment 1, 2024-2033
6.3.6.3. Historic Market Data & Future Forecasts, By Segment 2, 2024-2033

6.4. Asia Pacific
6.4.1. Historic Market Data & Future Forecasts, 2024-2033
6.4.2. Historic Market Data & Future Forecasts, By Segment 1, 2024-2033
6.4.3. Historic Market Data & Future Forecasts, By Segment 2, 2024-2033

6.4.4. China
6.4.4.1. Historic Market Data & Future Forecasts, 2024-2033
6.4.4.2. Historic Market Data & Future Forecasts, By Segment 1, 2024-2033
6.4.4.3. Historic Market Data & Future Forecasts, By Segment 2, 2024-2033

6.4.5. India
6.4.5.1. Historic Market Data & Future Forecasts, 2024-2033
6.4.5.2. Historic Market Data & Future Forecasts, By Segment 1, 2024-2033
6.4.5.3. Historic Market Data & Future Forecasts, By Segment 2, 2024-2033

6.4.6. Japan
6.4.6.1. Historic Market Data & Future Forecasts, 2024-2033
6.4.6.2. Historic Market Data & Future Forecasts, By Segment 1, 2024-2033
6.4.6.3. Historic Market Data & Future Forecasts, By Segment 2, 2024-2033

6.4.7. South Korea
6.4.7.1. Historic Market Data & Future Forecasts, 2024-2033
6.4.7.2. Historic Market Data & Future Forecasts, By Segment 1, 2024-2033
6.4.7.3. Historic Market Data & Future Forecasts, By Segment 2, 2024-2033

6.5. Latin America
6.5.1. Historic Market Data & Future Forecasts, 2024-2033
6.5.2. Historic Market Data & Future Forecasts, By Segment 1, 2024-2033
6.5.3. Historic Market Data & Future Forecasts, By Segment 2, 2024-2033

6.5.4. Brazil
6.5.4.1. Historic Market Data & Future Forecasts, 2024-2033
6.5.4.2. Historic Market Data & Future Forecasts, By Segment 1, 2024-2033
6.5.4.3. Historic Market Data & Future Forecasts, By Segment 2, 2024-2033

6.5.5. Mexico
6.5.5.1. Historic Market Data & Future Forecasts, 2024-2033
6.5.5.2. Historic Market Data & Future Forecasts, By Segment 1, 2024-2033
6.5.5.3. Historic Market Data & Future Forecasts, By Segment 2, 2024-2033

6.6. Middle East & Africa
6.6.1. Historic Market Data & Future Forecasts, 2024-2033
6.6.2. Historic Market Data & Future Forecasts, By Segment 1, 2024-2033
6.6.3. Historic Market Data & Future Forecasts, By Segment 2, 2024-2033

6.6.4. UAE
6.6.4.1. Historic Market Data & Future Forecasts, 2024-2033
6.6.4.2. Historic Market Data & Future Forecasts, By Segment 1, 2024-2033
6.6.4.3. Historic Market Data & Future Forecasts, By Segment 2, 2024-2033

6.6.5. Saudi Arabia
6.6.5.1. Historic Market Data & Future Forecasts, 2024-2033
6.6.5.2. Historic Market Data & Future Forecasts, By Segment 1, 2024-2033
6.6.5.3. Historic Market Data & Future Forecasts, By Segment 2, 2024-2033

6.6.6. South Africa
6.6.6.1. Historic Market Data & Future Forecasts, 2024-2033
6.6.6.2. Historic Market Data & Future Forecasts, By Segment 1, 2024-2033
6.6.6.3. Historic Market Data & Future Forecasts, By Segment 2, 2024-2033

Chapter 7. Competitive Landscape

7.1. Competitive Heatmap Analysis, 2023
7.2. Competitive Product Analysis

7.3. Company 1
7.3.1. Company Description
7.3.2. Financial Highlights
7.3.3. Product Portfolio
7.3.4. Strategic Initiatives

7.4. Company 2
7.4.1. Company Description
7.4.2. Financial Highlights
7.4.3. Product Portfolio
7.4.4. Strategic Initiatives

7.5. Company 3
7.5.1. Company Description
7.5.2. Financial Highlights
7.5.3. Product Portfolio
7.5.4. Strategic Initiatives

7.6. Company 4
7.6.1. Company Description
7.6.2. Financial Highlights
7.6.3. Product Portfolio
7.6.4. Strategic Initiatives

7.7. Company 5
7.7.1. Company Description
7.7.2. Financial Highlights
7.7.3. Product Portfolio
7.7.4. Strategic Initiatives

7.8. Company 6
7.8.1. Company Description
7.8.2. Financial Highlights
7.8.3. Product Portfolio
7.8.4. Strategic Initiatives

7.9. Company 7
7.9.1. Company Description
7.9.2. Financial Highlights
7.9.3. Product Portfolio
7.9.4. Strategic Initiatives

7.10. Company 8
7.10.1. Company Description
7.10.2. Financial Highlights
7.10.3. Product Portfolio
7.10.4. Strategic Initiatives

7.11. Company 9
7.11.1. Company Description
7.11.2. Financial Highlights
7.11.3. Product Portfolio
7.11.4. Strategic Initiatives

7.12. Company 10
7.12.1. Company Description
7.12.2. Financial Highlights
7.12.3. Product Portfolio
7.12.4. Strategic Initiatives

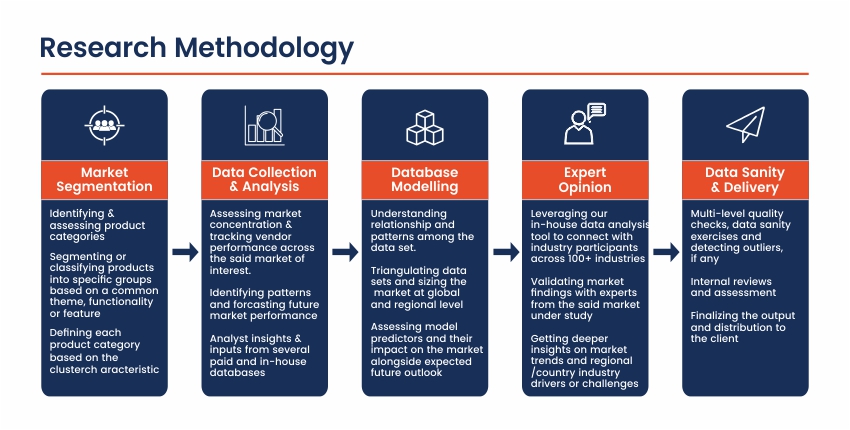
Research Methodology

Frequently Asked Questions About This Report

Choose License Type

$1,800
$2,340
$2,970

Our salient features

Best Solution

We will assist you in comprehending the value propositions of various reports across multiple domains and recommend the optimal solution to meet your research requirements.

Customized Research

Our team of analysts and consultants provide assistance for customized research requirements

Max ROI

Guaranteed maximum assistance to help you get your reports at the optimum prices, thereby ensuring maximum returns on investment.

24/7 Support

24X7 availability to help you through the buying process as well as answer any of your doubts.

Get a free sample report

This free sample study provides a comprehensive overview of the report, including an executive summary, market segments, complete analysis, country-level analysis, and more.

Our Clients

We've Received Your Request

We Thank You for filling out your requirements. Our sales team will get in touch with you shortly.