U.S. Group 2 Powered Mobility Devices Market Size, Share, Growth, Trends, Statistics Analysis Report and By Segment Forecasts 2024 to 2033

Market Overview

The US Group 2 Powered Mobility Devices market has experienced significant growth in recent years, driven by the increasing prevalence of mobility-related disabilities, the aging population, and the rising demand for accessible and independent living solutions. Group 2 powered mobility devices, which include power wheelchairs and scooters, have become essential tools for individuals with various physical limitations, enabling them to maintain their independence, improve their quality of life, and actively participate in their communities.

These devices are designed to provide a higher level of functionality and customization compared to basic manual wheelchairs, catering to the diverse needs and preferences of users. The market has witnessed the introduction of innovative technologies, enhanced safety features, and the integration of connectivity solutions, all of which have contributed to the growing adoption of Group 2 powered mobility devices in the United States.
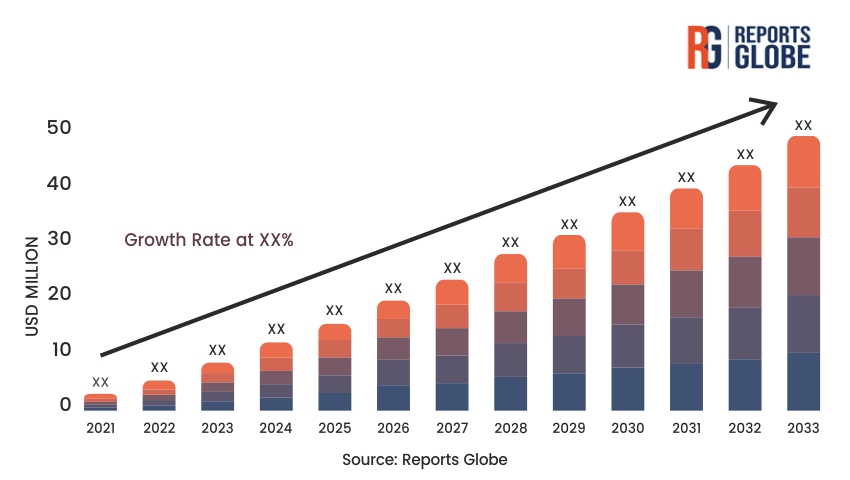
Key Takeaways of the market

  • The US Group 2 Powered Mobility Devices market is expanding rapidly, driven by the aging population and the increasing prevalence of mobility-related disabilities.
  • Technological advancements, such as improved battery life, enhanced maneuverability, and connectivity features, are driving the adoption of these devices.
  • Increased awareness and advocacy for accessible and inclusive living environments are contributing to the growth of the market.
  • Regulatory frameworks and government initiatives are supporting the development and widespread adoption of Group 2 powered mobility devices.
  • The market is becoming more competitive, with both established players and new entrants vying for market share through product innovation and strategic partnerships.

Market Drivers

The US Group 2 Powered Mobility Devices market is primarily driven by the growing population of individuals with mobility-related disabilities and the aging demographic. As the baby boomer generation continues to age, the prevalence of conditions such as arthritis, cardiovascular diseases, and neurological disorders has increased, leading to a rising demand for advanced mobility solutions.

Furthermore, the shift towards inclusive living environments and the emphasis on independent living have also contributed to the growth of the Group 2 powered mobility devices market. Individuals with disabilities and the elderly are increasingly seeking ways to maintain their autonomy, personal freedom, and social participation, and Group 2 powered mobility devices have become essential tools in enabling this.

Additionally, technological advancements in the field of powered mobility devices have played a significant role in driving market growth. Improvements in battery life, enhanced maneuverability, and the integration of connectivity features, such as Bluetooth and GPS, have made these devices more user-friendly, reliable, and responsive to the needs of individuals with varying levels of mobility challenges.

The increasing awareness and advocacy efforts by various organizations and government agencies have also contributed to the growing adoption of Group 2 powered mobility devices. These initiatives have focused on educating the public about the benefits of these devices, addressing accessibility issues, and promoting the importance of inclusive living environments.

Market Restraints

One of the primary restraints in the US Group 2 Powered Mobility Devices market is the high cost associated with these devices. Power wheelchairs and scooters can be relatively expensive, with prices ranging from several thousand to tens of thousands of dollars, depending on the level of customization and advanced features. This high cost can be a significant barrier for individuals, particularly those with limited financial resources or inadequate insurance coverage, which can limit the overall accessibility and adoption of these devices.

Another restraint is the complex and often lengthy process of obtaining insurance coverage or reimbursement for Group 2 powered mobility devices. The eligibility criteria, documentation requirements, and approval procedures can be challenging to navigate, especially for individuals who are unfamiliar with the healthcare system or have limited access to resources. This can deter potential users from pursuing these devices, despite their essential role in improving their quality of life.

Furthermore, the market is also facing challenges related to the regulatory environment and the need for ongoing maintenance and service for these devices. The regulatory landscape, which includes various safety standards and device classification criteria, can create uncertainties and delays in the approval and introduction of new product innovations. Additionally, the need for regular maintenance, repairs, and replacement of components can be a burden for users, potentially limiting the long-term usage and satisfaction with these devices.

Market Opportunities

The US Group 2 Powered Mobility Devices market presents several promising opportunities for growth and expansion. One significant opportunity lies in the increasing emphasis on inclusive and accessible living environments. As government agencies, policymakers, and various organizations work towards creating more inclusive communities, the demand for advanced mobility solutions, such as Group 2 powered mobility devices, is expected to rise.

Another opportunity stems from the growing awareness and advocacy efforts surrounding the benefits of these devices. Continued education and outreach campaigns targeting individuals with mobility-related disabilities, their caregivers, and healthcare professionals can help to destigmatize the use of powered mobility devices and increase their adoption.

Furthermore, the integration of cutting-edge technologies, such as artificial intelligence, machine learning, and Internet of Things (IoT) devices, can unlock new opportunities for enhanced user experiences and improved device performance. The development of smart features, predictive maintenance capabilities, and seamless connectivity can not only enhance the functionality of these devices but also address the concerns related to maintenance and service.

Additionally, the market can capitalize on the growing trend of personalization and customization. By offering a wider range of customization options, from aesthetics to specialized features, manufacturers can cater to the diverse preferences and needs of users, ultimately driving increased adoption and brand loyalty.

Market Segment Analysis

Power Wheelchairs Segment The power wheelchairs segment within the US Group 2 Powered Mobility Devices market is a crucial and rapidly growing category. Power wheelchairs are designed to provide users with a higher level of functionality, control, and customization compared to manual wheelchairs, catering to individuals with more severe mobility impairments or complex needs.

The power wheelchair segment has witnessed significant advancements in terms of battery life, maneuverability, and advanced seating systems. These improvements have enhanced the user experience, allowing individuals to navigate various environments with greater ease and independence. Moreover, the integration of connectivity features, such as Bluetooth and mobile app integration, has enabled users to personalize their wheelchair settings, monitor their device performance, and seamlessly integrate with their everyday lives.

The growing awareness of the benefits of power wheelchairs, coupled with the increasing prevalence of mobility-related disabilities, has fueled the demand for these devices. Manufacturers have responded by developing a wide range of power wheelchair models, catering to different user needs, such as indoor/outdoor use, complex rehabilitation requirements, and pediatric applications.

Mobility Scooters Segment The mobility scooters segment within the US Group 2 Powered Mobility Devices market has also experienced substantial growth in recent years. Mobility scooters are an alternative to power wheelchairs, offering users a more compact and maneuverable option for short-distance transportation and outdoor mobility.

The mobility scooters segment has witnessed the introduction of various product innovations, such as increased battery life, improved stability and suspension systems, and enhanced safety features. These advancements have made mobility scooters more reliable, comfortable, and accessible for individuals with mild to moderate mobility impairments.

One of the key drivers for the growth of the mobility scooters segment is the preference for a more versatile and portable mobility solution among users. Mobility scooters are often seen as a more practical option for running errands, navigating public spaces, and participating in social activities, as they offer a balance between functionality and portability.

Furthermore, the increasing acceptance and normalization of mobility scooters in various public and private settings have contributed to their growing adoption. As accessibility and inclusion become more prominent societal priorities, the demand for mobility scooters as an effective means of transportation and independence has risen.

Regional Analysis

The US Group 2 Powered Mobility Devices market exhibits distinct regional variations, with certain states and geographic areas emerging as key hubs for the industry.

California, for instance, is a significant market for Group 2 powered mobility devices, owing to its large population, high prevalence of mobility-related disabilities, and the presence of a well-developed healthcare infrastructure. The state’s climate and terrain also make it an attractive location for the use of these devices, as users can benefit from outdoor mobility and accessibility.

Another influential region is the Northeast, particularly states like New York and Massachusetts, which have a sizable elderly population and a strong focus on accessibility and inclusion. The high population density and the presence of major metropolitan areas in this region have driven the demand for Group 2 powered mobility devices, as users seek solutions to navigate these urban environments.

The Midwest region, with its growing elderly population and emphasis on independent living, has also witnessed a rise in the adoption of Group 2 powered mobility devices. States like Illinois and Ohio have seen an increase in the number of specialized healthcare facilities and home healthcare services that cater to the needs of individuals with mobility-related challenges.

Furthermore, the Southeast region, with its warmer climate and growing retiree population, has become a significant market for Group 2 powered mobility devices. States like Florida and Texas have experienced a surge in demand, as residents seek solutions to maintain their active lifestyles and participate in outdoor activities.

Across all regions, the availability of funding sources, such as Medicare, Medicaid, and private insurance coverage, as well as the presence of specialized providers and rehabilitation centers, have played a crucial role in shaping the regional dynamics of the US Group 2 Powered Mobility Devices market.

Competitive Analysis

The US Group 2 Powered Mobility Devices market is characterized by a highly competitive landscape, with both established players and emerging manufacturers vying for market share. The market is dominated by a few major players, who have built strong brand recognition, extensive distribution networks, and a reputation for innovative product development.

Companies like Permobil, Pride Mobility, and Invacare have maintained a dominant position in the market, leveraging their expertise in engineering, product customization, and customer service. These established players have continuously invested in research and development to introduce advanced features, such as improved battery life, enhanced maneuverability, and integrated connectivity solutions, to stay ahead of the competition.

However, the market has also seen the emergence of smaller, specialized manufacturers that are challenging the dominance of the larger players. These new entrants, such as Sunrise Medical and Drive DeVilbiss Healthcare, are often focused on addressing unmet needs or targeting specific user segments with tailored solutions. They have been able to differentiate themselves through innovative product designs, personalization options, and a customer-centric approach.

The competitive landscape is further shaped by the strategic partnerships and collaborations within the industry. Manufacturers are increasingly teaming up with healthcare providers, rehabilitation centers, and mobility equipment suppliers to ensure seamless integration of their products into the continuum of care and to enhance the overall user experience.

Moreover, the market has witnessed the entry of technology companies and digital health startups, which are exploring ways to integrate advanced technologies, such as artificial intelligence and connected devices, into the Group 2 powered mobility devices ecosystem. These non-traditional players are bringing a fresh perspective and driving further innovation within the market.

The intense competition in the US Group 2 Powered Mobility Devices market has led to a continuous focus on product differentiation, customer service, and the development of comprehensive solutions that cater to the diverse needs of individuals with mobility-related challenges.

Key Industry Developments

  • Advancements in battery technology, resulting in improved battery life and reduced charging times for powered mobility devices.
  • Integration of connectivity features, such as Bluetooth, GPS, and mobile app integration, to enhance user control and monitoring capabilities.
  • Incorporation of advanced seating systems and customization options to improve comfort, posture support, and personalization.
  • Increased focus on the development of pediatric-specific powered mobility devices to address the needs of younger users.
  • Expansion of remote servicing and telehealth solutions to streamline the maintenance and repair process for powered mobility devices.
  • Collaboration between manufacturers, healthcare providers, and mobility equipment suppliers to improve the seamless integration of powered mobility devices into the continuum of care.
  • Growing emphasis on environmental sustainability and the development of energy-efficient powered mobility devices.

Future Outlook

The future outlook for the US Group 2 Powered Mobility Devices market remains highly promising, as the industry continues to evolve and adapt to the changing needs of individuals with mobility-related challenges. The market is poised to experience sustained growth, driven by the increasing prevalence of mobility disabilities, the aging population, and the growing emphasis on inclusive living environments.

Technological advancements will play a pivotal role in shaping the future of the market, as manufacturers continue to invest in innovative solutions that enhance the functionality, user experience, and connectivity of powered mobility devices. The integration of emerging technologies, such as artificial intelligence, machine learning, and Internet of Things (IoT), will enable the development of more intelligent, adaptive, and personalized devices.

The market is also expected to witness a greater focus on environmental sustainability, with manufacturers prioritizing the development of energy-efficient and eco-friendly powered mobility solutions. This shift towards sustainability will not only address the growing concerns about the environmental impact but also appeal to eco-conscious consumers and align with the broader societal trends towards sustainability.

Furthermore, the growing emphasis on telehealth and remote servicing will significantly impact the market, as it will improve the accessibility and maintenance of powered mobility devices. The ability to remotely diagnose, troubleshoot, and provide technical support will enhance the user experience and reduce the burden on individuals with limited mobility or access to physical service centers.

The competitive landscape is also expected to evolve, with strategic partnerships, mergers, and acquisitions becoming more prevalent. Manufacturers will seek to capitalize on synergies, expand their product portfolios, and enhance their market presence through collaborative efforts. Additionally, the entry of non-traditional players, such as technology companies and digital health startups, will continue to drive innovation and challenge the status quo in the industry.

Overall, the US Group 2 Powered Mobility Devices market is poised for a future characterized by technological advancements, environmental sustainability, and a heightened focus on user-centric solutions that empower individuals with mobility-related disabilities to live more independent and fulfilling lives.

Market Segmentation

  • Power Wheelchairs
    • Indoor/Outdoor Power Wheelchairs
    • Complex Rehab Power Wheelchairs
    • Pediatric Power Wheelchairs
  • Mobility Scooters
    • 3-Wheel Mobility Scooters
    • 4-Wheel Mobility Scooters
    • Heavy-Duty Mobility Scooters
  • Accessories and Customization Options
    • Seating and Positioning Systems
    • Specialty Controls and Input Devices
    • Lighting and Visibility Enhancements
    • Connectivity and Smart Features

Table of Contents

Chapter 1. Research Methodology & Data Sources

1.1. Data Analysis Models
1.2. Research Scope & Assumptions
1.3. List of Primary & Secondary Data Sources 

Chapter 2. Executive Summary

2.1. Market Overview
2.2. Segment Overview
2.3. Market Size and Estimates, 2021 to 2033
2.4. Market Size and Estimates, By Segments, 2021 to 2033

Chapter 3. Industry Analysis

3.1. Market Segmentation
3.2. Market Definitions and Assumptions
3.3. Supply chain analysis
3.4. Porter’s five forces analysis
3.5. PEST analysis
3.6. Market Dynamics
3.6.1. Market Driver Analysis
3.6.2. Market Restraint analysis
3.6.3. Market Opportunity Analysis
3.7. Competitive Positioning Analysis, 2023
3.8. Key Player Ranking, 2023

Chapter 4. Market Segment Analysis- Segment 1

4.1.1. Historic Market Data & Future Forecasts, 2024-2033
4.1.2. Historic Market Data & Future Forecasts by Region, 2024-2033

Chapter 5. Market Segment Analysis- Segment 2

5.1.1. Historic Market Data & Future Forecasts, 2024-2033
5.1.2. Historic Market Data & Future Forecasts by Region, 2024-2033

Chapter 6. Regional or Country Market Insights

** Reports focusing on a particular region or country will contain data unique to that region or country **

6.1. Global Market Data & Future Forecasts, By Region 2024-2033

6.2. North America
6.2.1. Historic Market Data & Future Forecasts, 2024-2033
6.2.2. Historic Market Data & Future Forecasts, By Segment 1, 2024-2033
6.2.3. Historic Market Data & Future Forecasts, By Segment 2, 2024-2033

6.2.4. U.S.
6.2.4.1. Historic Market Data & Future Forecasts, 2024-2033
6.2.4.2. Historic Market Data & Future Forecasts, By Segment 1, 2024-2033
6.2.4.3. Historic Market Data & Future Forecasts, By Segment 2, 2024-2033

6.2.5. Canada
6.2.5.1. Historic Market Data & Future Forecasts, 2024-2033
6.2.5.2. Historic Market Data & Future Forecasts, By Segment 1, 2024-2033
6.2.5.3. Historic Market Data & Future Forecasts, By Segment 2, 2024-2033

6.3. Europe
6.3.1. Historic Market Data & Future Forecasts, 2024-2033
6.3.2. Historic Market Data & Future Forecasts, By Segment 1, 2024-2033
6.3.3. Historic Market Data & Future Forecasts, By Segment 2, 2024-2033

6.3.4. UK
6.3.4.1. Historic Market Data & Future Forecasts, 2024-2033
6.3.4.2. Historic Market Data & Future Forecasts, By Segment 1, 2024-2033
6.3.4.3. Historic Market Data & Future Forecasts, By Segment 2, 2024-2033

6.3.5. Germany
6.3.5.1. Historic Market Data & Future Forecasts, 2024-2033
6.3.5.2. Historic Market Data & Future Forecasts, By Segment 1, 2024-2033
6.3.5.3. Historic Market Data & Future Forecasts, By Segment 2, 2024-2033

6.3.6. France
6.3.6.1. Historic Market Data & Future Forecasts, 2024-2033
6.3.6.2. Historic Market Data & Future Forecasts, By Segment 1, 2024-2033
6.3.6.3. Historic Market Data & Future Forecasts, By Segment 2, 2024-2033

6.4. Asia Pacific
6.4.1. Historic Market Data & Future Forecasts, 2024-2033
6.4.2. Historic Market Data & Future Forecasts, By Segment 1, 2024-2033
6.4.3. Historic Market Data & Future Forecasts, By Segment 2, 2024-2033

6.4.4. China
6.4.4.1. Historic Market Data & Future Forecasts, 2024-2033
6.4.4.2. Historic Market Data & Future Forecasts, By Segment 1, 2024-2033
6.4.4.3. Historic Market Data & Future Forecasts, By Segment 2, 2024-2033

6.4.5. India
6.4.5.1. Historic Market Data & Future Forecasts, 2024-2033
6.4.5.2. Historic Market Data & Future Forecasts, By Segment 1, 2024-2033
6.4.5.3. Historic Market Data & Future Forecasts, By Segment 2, 2024-2033

6.4.6. Japan
6.4.6.1. Historic Market Data & Future Forecasts, 2024-2033
6.4.6.2. Historic Market Data & Future Forecasts, By Segment 1, 2024-2033
6.4.6.3. Historic Market Data & Future Forecasts, By Segment 2, 2024-2033

6.4.7. South Korea
6.4.7.1. Historic Market Data & Future Forecasts, 2024-2033
6.4.7.2. Historic Market Data & Future Forecasts, By Segment 1, 2024-2033
6.4.7.3. Historic Market Data & Future Forecasts, By Segment 2, 2024-2033

6.5. Latin America
6.5.1. Historic Market Data & Future Forecasts, 2024-2033
6.5.2. Historic Market Data & Future Forecasts, By Segment 1, 2024-2033
6.5.3. Historic Market Data & Future Forecasts, By Segment 2, 2024-2033

6.5.4. Brazil
6.5.4.1. Historic Market Data & Future Forecasts, 2024-2033
6.5.4.2. Historic Market Data & Future Forecasts, By Segment 1, 2024-2033
6.5.4.3. Historic Market Data & Future Forecasts, By Segment 2, 2024-2033

6.5.5. Mexico
6.5.5.1. Historic Market Data & Future Forecasts, 2024-2033
6.5.5.2. Historic Market Data & Future Forecasts, By Segment 1, 2024-2033
6.5.5.3. Historic Market Data & Future Forecasts, By Segment 2, 2024-2033

6.6. Middle East & Africa
6.6.1. Historic Market Data & Future Forecasts, 2024-2033
6.6.2. Historic Market Data & Future Forecasts, By Segment 1, 2024-2033
6.6.3. Historic Market Data & Future Forecasts, By Segment 2, 2024-2033

6.6.4. UAE
6.6.4.1. Historic Market Data & Future Forecasts, 2024-2033
6.6.4.2. Historic Market Data & Future Forecasts, By Segment 1, 2024-2033
6.6.4.3. Historic Market Data & Future Forecasts, By Segment 2, 2024-2033

6.6.5. Saudi Arabia
6.6.5.1. Historic Market Data & Future Forecasts, 2024-2033
6.6.5.2. Historic Market Data & Future Forecasts, By Segment 1, 2024-2033
6.6.5.3. Historic Market Data & Future Forecasts, By Segment 2, 2024-2033

6.6.6. South Africa
6.6.6.1. Historic Market Data & Future Forecasts, 2024-2033
6.6.6.2. Historic Market Data & Future Forecasts, By Segment 1, 2024-2033
6.6.6.3. Historic Market Data & Future Forecasts, By Segment 2, 2024-2033

Chapter 7. Competitive Landscape

7.1. Competitive Heatmap Analysis, 2023
7.2. Competitive Product Analysis

7.3. Company 1
7.3.1. Company Description
7.3.2. Financial Highlights
7.3.3. Product Portfolio
7.3.4. Strategic Initiatives

7.4. Company 2
7.4.1. Company Description
7.4.2. Financial Highlights
7.4.3. Product Portfolio
7.4.4. Strategic Initiatives

7.5. Company 3
7.5.1. Company Description
7.5.2. Financial Highlights
7.5.3. Product Portfolio
7.5.4. Strategic Initiatives

7.6. Company 4
7.6.1. Company Description
7.6.2. Financial Highlights
7.6.3. Product Portfolio
7.6.4. Strategic Initiatives

7.7. Company 5
7.7.1. Company Description
7.7.2. Financial Highlights
7.7.3. Product Portfolio
7.7.4. Strategic Initiatives

7.8. Company 6
7.8.1. Company Description
7.8.2. Financial Highlights
7.8.3. Product Portfolio
7.8.4. Strategic Initiatives

7.9. Company 7
7.9.1. Company Description
7.9.2. Financial Highlights
7.9.3. Product Portfolio
7.9.4. Strategic Initiatives

7.10. Company 8
7.10.1. Company Description
7.10.2. Financial Highlights
7.10.3. Product Portfolio
7.10.4. Strategic Initiatives

7.11. Company 9
7.11.1. Company Description
7.11.2. Financial Highlights
7.11.3. Product Portfolio
7.11.4. Strategic Initiatives

7.12. Company 10
7.12.1. Company Description
7.12.2. Financial Highlights
7.12.3. Product Portfolio
7.12.4. Strategic Initiatives

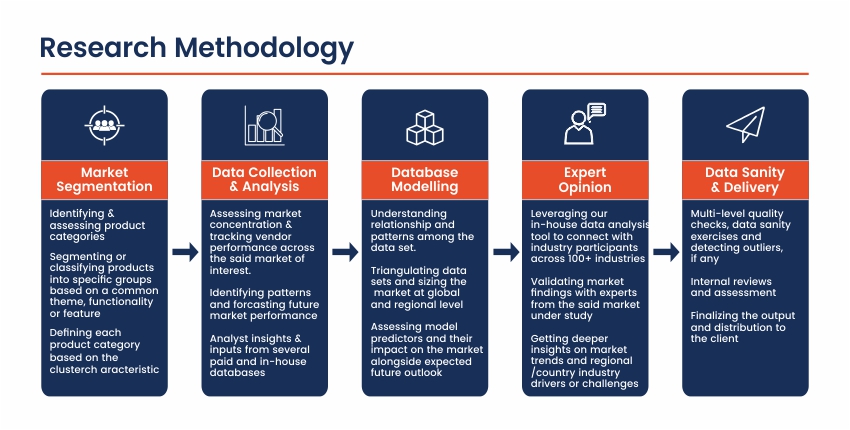
Research Methodology

Market Overview

The US Group 2 Powered Mobility Devices market has experienced significant growth in recent years, driven by the increasing prevalence of mobility-related disabilities, the aging population, and the rising demand for accessible and independent living solutions. Group 2 powered mobility devices, which include power wheelchairs and scooters, have become essential tools for individuals with various physical limitations, enabling them to maintain their independence, improve their quality of life, and actively participate in their communities.

These devices are designed to provide a higher level of functionality and customization compared to basic manual wheelchairs, catering to the diverse needs and preferences of users. The market has witnessed the introduction of innovative technologies, enhanced safety features, and the integration of connectivity solutions, all of which have contributed to the growing adoption of Group 2 powered mobility devices in the United States.

Key Takeaways of the market

  • The US Group 2 Powered Mobility Devices market is expanding rapidly, driven by the aging population and the increasing prevalence of mobility-related disabilities.
  • Technological advancements, such as improved battery life, enhanced maneuverability, and connectivity features, are driving the adoption of these devices.
  • Increased awareness and advocacy for accessible and inclusive living environments are contributing to the growth of the market.
  • Regulatory frameworks and government initiatives are supporting the development and widespread adoption of Group 2 powered mobility devices.
  • The market is becoming more competitive, with both established players and new entrants vying for market share through product innovation and strategic partnerships.

Market Drivers

The US Group 2 Powered Mobility Devices market is primarily driven by the growing population of individuals with mobility-related disabilities and the aging demographic. As the baby boomer generation continues to age, the prevalence of conditions such as arthritis, cardiovascular diseases, and neurological disorders has increased, leading to a rising demand for advanced mobility solutions.

Furthermore, the shift towards inclusive living environments and the emphasis on independent living have also contributed to the growth of the Group 2 powered mobility devices market. Individuals with disabilities and the elderly are increasingly seeking ways to maintain their autonomy, personal freedom, and social participation, and Group 2 powered mobility devices have become essential tools in enabling this.

Additionally, technological advancements in the field of powered mobility devices have played a significant role in driving market growth. Improvements in battery life, enhanced maneuverability, and the integration of connectivity features, such as Bluetooth and GPS, have made these devices more user-friendly, reliable, and responsive to the needs of individuals with varying levels of mobility challenges.

The increasing awareness and advocacy efforts by various organizations and government agencies have also contributed to the growing adoption of Group 2 powered mobility devices. These initiatives have focused on educating the public about the benefits of these devices, addressing accessibility issues, and promoting the importance of inclusive living environments.

Market Restraints

One of the primary restraints in the US Group 2 Powered Mobility Devices market is the high cost associated with these devices. Power wheelchairs and scooters can be relatively expensive, with prices ranging from several thousand to tens of thousands of dollars, depending on the level of customization and advanced features. This high cost can be a significant barrier for individuals, particularly those with limited financial resources or inadequate insurance coverage, which can limit the overall accessibility and adoption of these devices.

Another restraint is the complex and often lengthy process of obtaining insurance coverage or reimbursement for Group 2 powered mobility devices. The eligibility criteria, documentation requirements, and approval procedures can be challenging to navigate, especially for individuals who are unfamiliar with the healthcare system or have limited access to resources. This can deter potential users from pursuing these devices, despite their essential role in improving their quality of life.

Furthermore, the market is also facing challenges related to the regulatory environment and the need for ongoing maintenance and service for these devices. The regulatory landscape, which includes various safety standards and device classification criteria, can create uncertainties and delays in the approval and introduction of new product innovations. Additionally, the need for regular maintenance, repairs, and replacement of components can be a burden for users, potentially limiting the long-term usage and satisfaction with these devices.

Market Opportunities

The US Group 2 Powered Mobility Devices market presents several promising opportunities for growth and expansion. One significant opportunity lies in the increasing emphasis on inclusive and accessible living environments. As government agencies, policymakers, and various organizations work towards creating more inclusive communities, the demand for advanced mobility solutions, such as Group 2 powered mobility devices, is expected to rise.

Another opportunity stems from the growing awareness and advocacy efforts surrounding the benefits of these devices. Continued education and outreach campaigns targeting individuals with mobility-related disabilities, their caregivers, and healthcare professionals can help to destigmatize the use of powered mobility devices and increase their adoption.

Furthermore, the integration of cutting-edge technologies, such as artificial intelligence, machine learning, and Internet of Things (IoT) devices, can unlock new opportunities for enhanced user experiences and improved device performance. The development of smart features, predictive maintenance capabilities, and seamless connectivity can not only enhance the functionality of these devices but also address the concerns related to maintenance and service.

Additionally, the market can capitalize on the growing trend of personalization and customization. By offering a wider range of customization options, from aesthetics to specialized features, manufacturers can cater to the diverse preferences and needs of users, ultimately driving increased adoption and brand loyalty.

Market Segment Analysis

Power Wheelchairs Segment The power wheelchairs segment within the US Group 2 Powered Mobility Devices market is a crucial and rapidly growing category. Power wheelchairs are designed to provide users with a higher level of functionality, control, and customization compared to manual wheelchairs, catering to individuals with more severe mobility impairments or complex needs.

The power wheelchair segment has witnessed significant advancements in terms of battery life, maneuverability, and advanced seating systems. These improvements have enhanced the user experience, allowing individuals to navigate various environments with greater ease and independence. Moreover, the integration of connectivity features, such as Bluetooth and mobile app integration, has enabled users to personalize their wheelchair settings, monitor their device performance, and seamlessly integrate with their everyday lives.

The growing awareness of the benefits of power wheelchairs, coupled with the increasing prevalence of mobility-related disabilities, has fueled the demand for these devices. Manufacturers have responded by developing a wide range of power wheelchair models, catering to different user needs, such as indoor/outdoor use, complex rehabilitation requirements, and pediatric applications.

Mobility Scooters Segment The mobility scooters segment within the US Group 2 Powered Mobility Devices market has also experienced substantial growth in recent years. Mobility scooters are an alternative to power wheelchairs, offering users a more compact and maneuverable option for short-distance transportation and outdoor mobility.

The mobility scooters segment has witnessed the introduction of various product innovations, such as increased battery life, improved stability and suspension systems, and enhanced safety features. These advancements have made mobility scooters more reliable, comfortable, and accessible for individuals with mild to moderate mobility impairments.

One of the key drivers for the growth of the mobility scooters segment is the preference for a more versatile and portable mobility solution among users. Mobility scooters are often seen as a more practical option for running errands, navigating public spaces, and participating in social activities, as they offer a balance between functionality and portability.

Furthermore, the increasing acceptance and normalization of mobility scooters in various public and private settings have contributed to their growing adoption. As accessibility and inclusion become more prominent societal priorities, the demand for mobility scooters as an effective means of transportation and independence has risen.

Regional Analysis

The US Group 2 Powered Mobility Devices market exhibits distinct regional variations, with certain states and geographic areas emerging as key hubs for the industry.

California, for instance, is a significant market for Group 2 powered mobility devices, owing to its large population, high prevalence of mobility-related disabilities, and the presence of a well-developed healthcare infrastructure. The state’s climate and terrain also make it an attractive location for the use of these devices, as users can benefit from outdoor mobility and accessibility.

Another influential region is the Northeast, particularly states like New York and Massachusetts, which have a sizable elderly population and a strong focus on accessibility and inclusion. The high population density and the presence of major metropolitan areas in this region have driven the demand for Group 2 powered mobility devices, as users seek solutions to navigate these urban environments.

The Midwest region, with its growing elderly population and emphasis on independent living, has also witnessed a rise in the adoption of Group 2 powered mobility devices. States like Illinois and Ohio have seen an increase in the number of specialized healthcare facilities and home healthcare services that cater to the needs of individuals with mobility-related challenges.

Furthermore, the Southeast region, with its warmer climate and growing retiree population, has become a significant market for Group 2 powered mobility devices. States like Florida and Texas have experienced a surge in demand, as residents seek solutions to maintain their active lifestyles and participate in outdoor activities.

Across all regions, the availability of funding sources, such as Medicare, Medicaid, and private insurance coverage, as well as the presence of specialized providers and rehabilitation centers, have played a crucial role in shaping the regional dynamics of the US Group 2 Powered Mobility Devices market.

Competitive Analysis

The US Group 2 Powered Mobility Devices market is characterized by a highly competitive landscape, with both established players and emerging manufacturers vying for market share. The market is dominated by a few major players, who have built strong brand recognition, extensive distribution networks, and a reputation for innovative product development.

Companies like Permobil, Pride Mobility, and Invacare have maintained a dominant position in the market, leveraging their expertise in engineering, product customization, and customer service. These established players have continuously invested in research and development to introduce advanced features, such as improved battery life, enhanced maneuverability, and integrated connectivity solutions, to stay ahead of the competition.

However, the market has also seen the emergence of smaller, specialized manufacturers that are challenging the dominance of the larger players. These new entrants, such as Sunrise Medical and Drive DeVilbiss Healthcare, are often focused on addressing unmet needs or targeting specific user segments with tailored solutions. They have been able to differentiate themselves through innovative product designs, personalization options, and a customer-centric approach.

The competitive landscape is further shaped by the strategic partnerships and collaborations within the industry. Manufacturers are increasingly teaming up with healthcare providers, rehabilitation centers, and mobility equipment suppliers to ensure seamless integration of their products into the continuum of care and to enhance the overall user experience.

Moreover, the market has witnessed the entry of technology companies and digital health startups, which are exploring ways to integrate advanced technologies, such as artificial intelligence and connected devices, into the Group 2 powered mobility devices ecosystem. These non-traditional players are bringing a fresh perspective and driving further innovation within the market.

The intense competition in the US Group 2 Powered Mobility Devices market has led to a continuous focus on product differentiation, customer service, and the development of comprehensive solutions that cater to the diverse needs of individuals with mobility-related challenges.

Key Industry Developments

  • Advancements in battery technology, resulting in improved battery life and reduced charging times for powered mobility devices.
  • Integration of connectivity features, such as Bluetooth, GPS, and mobile app integration, to enhance user control and monitoring capabilities.
  • Incorporation of advanced seating systems and customization options to improve comfort, posture support, and personalization.
  • Increased focus on the development of pediatric-specific powered mobility devices to address the needs of younger users.
  • Expansion of remote servicing and telehealth solutions to streamline the maintenance and repair process for powered mobility devices.
  • Collaboration between manufacturers, healthcare providers, and mobility equipment suppliers to improve the seamless integration of powered mobility devices into the continuum of care.
  • Growing emphasis on environmental sustainability and the development of energy-efficient powered mobility devices.

Future Outlook

The future outlook for the US Group 2 Powered Mobility Devices market remains highly promising, as the industry continues to evolve and adapt to the changing needs of individuals with mobility-related challenges. The market is poised to experience sustained growth, driven by the increasing prevalence of mobility disabilities, the aging population, and the growing emphasis on inclusive living environments.

Technological advancements will play a pivotal role in shaping the future of the market, as manufacturers continue to invest in innovative solutions that enhance the functionality, user experience, and connectivity of powered mobility devices. The integration of emerging technologies, such as artificial intelligence, machine learning, and Internet of Things (IoT), will enable the development of more intelligent, adaptive, and personalized devices.

The market is also expected to witness a greater focus on environmental sustainability, with manufacturers prioritizing the development of energy-efficient and eco-friendly powered mobility solutions. This shift towards sustainability will not only address the growing concerns about the environmental impact but also appeal to eco-conscious consumers and align with the broader societal trends towards sustainability.

Furthermore, the growing emphasis on telehealth and remote servicing will significantly impact the market, as it will improve the accessibility and maintenance of powered mobility devices. The ability to remotely diagnose, troubleshoot, and provide technical support will enhance the user experience and reduce the burden on individuals with limited mobility or access to physical service centers.

The competitive landscape is also expected to evolve, with strategic partnerships, mergers, and acquisitions becoming more prevalent. Manufacturers will seek to capitalize on synergies, expand their product portfolios, and enhance their market presence through collaborative efforts. Additionally, the entry of non-traditional players, such as technology companies and digital health startups, will continue to drive innovation and challenge the status quo in the industry.

Overall, the US Group 2 Powered Mobility Devices market is poised for a future characterized by technological advancements, environmental sustainability, and a heightened focus on user-centric solutions that empower individuals with mobility-related disabilities to live more independent and fulfilling lives.

Market Segmentation

  • Power Wheelchairs
    • Indoor/Outdoor Power Wheelchairs
    • Complex Rehab Power Wheelchairs
    • Pediatric Power Wheelchairs
  • Mobility Scooters
    • 3-Wheel Mobility Scooters
    • 4-Wheel Mobility Scooters
    • Heavy-Duty Mobility Scooters
  • Accessories and Customization Options
    • Seating and Positioning Systems
    • Specialty Controls and Input Devices
    • Lighting and Visibility Enhancements
    • Connectivity and Smart Features

Table of Contents

Chapter 1. Research Methodology & Data Sources

1.1. Data Analysis Models
1.2. Research Scope & Assumptions
1.3. List of Primary & Secondary Data Sources 

Chapter 2. Executive Summary

2.1. Market Overview
2.2. Segment Overview
2.3. Market Size and Estimates, 2021 to 2033
2.4. Market Size and Estimates, By Segments, 2021 to 2033

Chapter 3. Industry Analysis

3.1. Market Segmentation
3.2. Market Definitions and Assumptions
3.3. Supply chain analysis
3.4. Porter’s five forces analysis
3.5. PEST analysis
3.6. Market Dynamics
3.6.1. Market Driver Analysis
3.6.2. Market Restraint analysis
3.6.3. Market Opportunity Analysis
3.7. Competitive Positioning Analysis, 2023
3.8. Key Player Ranking, 2023

Chapter 4. Market Segment Analysis- Segment 1

4.1.1. Historic Market Data & Future Forecasts, 2024-2033
4.1.2. Historic Market Data & Future Forecasts by Region, 2024-2033

Chapter 5. Market Segment Analysis- Segment 2

5.1.1. Historic Market Data & Future Forecasts, 2024-2033
5.1.2. Historic Market Data & Future Forecasts by Region, 2024-2033

Chapter 6. Regional or Country Market Insights

** Reports focusing on a particular region or country will contain data unique to that region or country **

6.1. Global Market Data & Future Forecasts, By Region 2024-2033

6.2. North America
6.2.1. Historic Market Data & Future Forecasts, 2024-2033
6.2.2. Historic Market Data & Future Forecasts, By Segment 1, 2024-2033
6.2.3. Historic Market Data & Future Forecasts, By Segment 2, 2024-2033

6.2.4. U.S.
6.2.4.1. Historic Market Data & Future Forecasts, 2024-2033
6.2.4.2. Historic Market Data & Future Forecasts, By Segment 1, 2024-2033
6.2.4.3. Historic Market Data & Future Forecasts, By Segment 2, 2024-2033

6.2.5. Canada
6.2.5.1. Historic Market Data & Future Forecasts, 2024-2033
6.2.5.2. Historic Market Data & Future Forecasts, By Segment 1, 2024-2033
6.2.5.3. Historic Market Data & Future Forecasts, By Segment 2, 2024-2033

6.3. Europe
6.3.1. Historic Market Data & Future Forecasts, 2024-2033
6.3.2. Historic Market Data & Future Forecasts, By Segment 1, 2024-2033
6.3.3. Historic Market Data & Future Forecasts, By Segment 2, 2024-2033

6.3.4. UK
6.3.4.1. Historic Market Data & Future Forecasts, 2024-2033
6.3.4.2. Historic Market Data & Future Forecasts, By Segment 1, 2024-2033
6.3.4.3. Historic Market Data & Future Forecasts, By Segment 2, 2024-2033

6.3.5. Germany
6.3.5.1. Historic Market Data & Future Forecasts, 2024-2033
6.3.5.2. Historic Market Data & Future Forecasts, By Segment 1, 2024-2033
6.3.5.3. Historic Market Data & Future Forecasts, By Segment 2, 2024-2033

6.3.6. France
6.3.6.1. Historic Market Data & Future Forecasts, 2024-2033
6.3.6.2. Historic Market Data & Future Forecasts, By Segment 1, 2024-2033
6.3.6.3. Historic Market Data & Future Forecasts, By Segment 2, 2024-2033

6.4. Asia Pacific
6.4.1. Historic Market Data & Future Forecasts, 2024-2033
6.4.2. Historic Market Data & Future Forecasts, By Segment 1, 2024-2033
6.4.3. Historic Market Data & Future Forecasts, By Segment 2, 2024-2033

6.4.4. China
6.4.4.1. Historic Market Data & Future Forecasts, 2024-2033
6.4.4.2. Historic Market Data & Future Forecasts, By Segment 1, 2024-2033
6.4.4.3. Historic Market Data & Future Forecasts, By Segment 2, 2024-2033

6.4.5. India
6.4.5.1. Historic Market Data & Future Forecasts, 2024-2033
6.4.5.2. Historic Market Data & Future Forecasts, By Segment 1, 2024-2033
6.4.5.3. Historic Market Data & Future Forecasts, By Segment 2, 2024-2033

6.4.6. Japan
6.4.6.1. Historic Market Data & Future Forecasts, 2024-2033
6.4.6.2. Historic Market Data & Future Forecasts, By Segment 1, 2024-2033
6.4.6.3. Historic Market Data & Future Forecasts, By Segment 2, 2024-2033

6.4.7. South Korea
6.4.7.1. Historic Market Data & Future Forecasts, 2024-2033
6.4.7.2. Historic Market Data & Future Forecasts, By Segment 1, 2024-2033
6.4.7.3. Historic Market Data & Future Forecasts, By Segment 2, 2024-2033

6.5. Latin America
6.5.1. Historic Market Data & Future Forecasts, 2024-2033
6.5.2. Historic Market Data & Future Forecasts, By Segment 1, 2024-2033
6.5.3. Historic Market Data & Future Forecasts, By Segment 2, 2024-2033

6.5.4. Brazil
6.5.4.1. Historic Market Data & Future Forecasts, 2024-2033
6.5.4.2. Historic Market Data & Future Forecasts, By Segment 1, 2024-2033
6.5.4.3. Historic Market Data & Future Forecasts, By Segment 2, 2024-2033

6.5.5. Mexico
6.5.5.1. Historic Market Data & Future Forecasts, 2024-2033
6.5.5.2. Historic Market Data & Future Forecasts, By Segment 1, 2024-2033
6.5.5.3. Historic Market Data & Future Forecasts, By Segment 2, 2024-2033

6.6. Middle East & Africa
6.6.1. Historic Market Data & Future Forecasts, 2024-2033
6.6.2. Historic Market Data & Future Forecasts, By Segment 1, 2024-2033
6.6.3. Historic Market Data & Future Forecasts, By Segment 2, 2024-2033

6.6.4. UAE
6.6.4.1. Historic Market Data & Future Forecasts, 2024-2033
6.6.4.2. Historic Market Data & Future Forecasts, By Segment 1, 2024-2033
6.6.4.3. Historic Market Data & Future Forecasts, By Segment 2, 2024-2033

6.6.5. Saudi Arabia
6.6.5.1. Historic Market Data & Future Forecasts, 2024-2033
6.6.5.2. Historic Market Data & Future Forecasts, By Segment 1, 2024-2033
6.6.5.3. Historic Market Data & Future Forecasts, By Segment 2, 2024-2033

6.6.6. South Africa
6.6.6.1. Historic Market Data & Future Forecasts, 2024-2033
6.6.6.2. Historic Market Data & Future Forecasts, By Segment 1, 2024-2033
6.6.6.3. Historic Market Data & Future Forecasts, By Segment 2, 2024-2033

Chapter 7. Competitive Landscape

7.1. Competitive Heatmap Analysis, 2023
7.2. Competitive Product Analysis

7.3. Company 1
7.3.1. Company Description
7.3.2. Financial Highlights
7.3.3. Product Portfolio
7.3.4. Strategic Initiatives

7.4. Company 2
7.4.1. Company Description
7.4.2. Financial Highlights
7.4.3. Product Portfolio
7.4.4. Strategic Initiatives

7.5. Company 3
7.5.1. Company Description
7.5.2. Financial Highlights
7.5.3. Product Portfolio
7.5.4. Strategic Initiatives

7.6. Company 4
7.6.1. Company Description
7.6.2. Financial Highlights
7.6.3. Product Portfolio
7.6.4. Strategic Initiatives

7.7. Company 5
7.7.1. Company Description
7.7.2. Financial Highlights
7.7.3. Product Portfolio
7.7.4. Strategic Initiatives

7.8. Company 6
7.8.1. Company Description
7.8.2. Financial Highlights
7.8.3. Product Portfolio
7.8.4. Strategic Initiatives

7.9. Company 7
7.9.1. Company Description
7.9.2. Financial Highlights
7.9.3. Product Portfolio
7.9.4. Strategic Initiatives

7.10. Company 8
7.10.1. Company Description
7.10.2. Financial Highlights
7.10.3. Product Portfolio
7.10.4. Strategic Initiatives

7.11. Company 9
7.11.1. Company Description
7.11.2. Financial Highlights
7.11.3. Product Portfolio
7.11.4. Strategic Initiatives

7.12. Company 10
7.12.1. Company Description
7.12.2. Financial Highlights
7.12.3. Product Portfolio
7.12.4. Strategic Initiatives

Research Methodology

Frequently Asked Questions About This Report

Choose License Type

$1,800
$2,340
$2,970

Our salient features

Best Solution

We will assist you in comprehending the value propositions of various reports across multiple domains and recommend the optimal solution to meet your research requirements.

Customized Research

Our team of analysts and consultants provide assistance for customized research requirements

Max ROI

Guaranteed maximum assistance to help you get your reports at the optimum prices, thereby ensuring maximum returns on investment.

24/7 Support

24X7 availability to help you through the buying process as well as answer any of your doubts.

Get a free sample report

This free sample study provides a comprehensive overview of the report, including an executive summary, market segments, complete analysis, country-level analysis, and more.

Our Clients

We've Received Your Request

We Thank You for filling out your requirements. Our sales team will get in touch with you shortly.