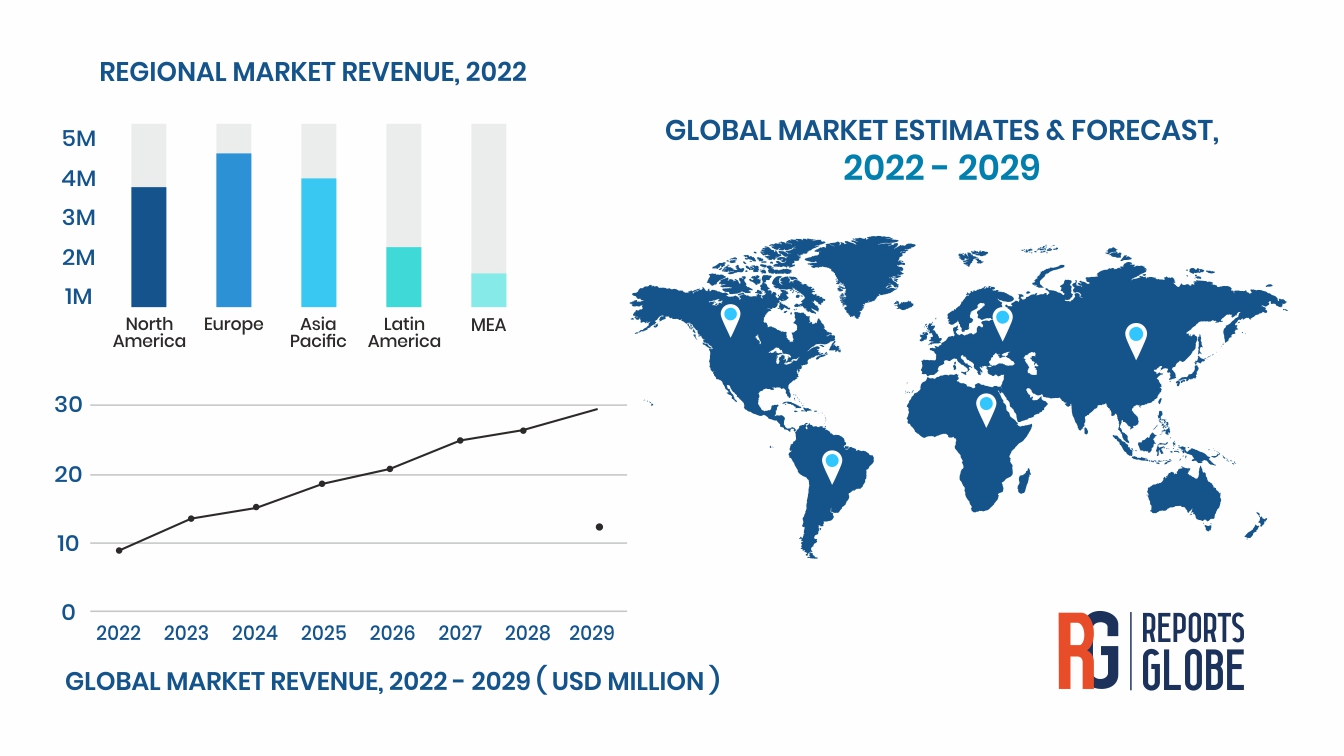
Pay TV market garnered a revenue of USD 219.7 billion in the year 2021 globally and has been foreseen to yield USD 282.8 billion by the year 2029 at a compound annual growth (CAGR) of 3.5% over the forecast period. The market has been observed to be growing at a steady growth rate over the last three years, however with the impact of COVID-19 pandemic globally, the business conditions are expected to change. The market size may reduce significantly or increase with a spike depending on how the value chain has been affected in the entire process.
Players that are operational in the market for a longer period of time are anticipated to absorb the sudden changes, losses and increased operational costs better than those who have recently entered the market. The report focuses on numerous factors that are anticipated to impact the market growth directly and indirectly. The report categorically analyses the growth patterns of different segments based on multiple derivation models.
Both the qualitative and quantitative aspects have been covered under the report. The Pay TV market report includes market size, drivers, restraints, opportunities and trends that will help you understand the market dynamics in detail. Moreover, the report will include market estimates & forecasts in terms of revenue for the overall market along with the segments mentioned in the study. The report focuses on providing a holistic view of the entire market scenario from multiple unmatched detailed analysis mentioned in the report.
What to expect from the report?
Pay TV Total Available Market (TAM)Size
Pay TV Serviceable Available Market (SAM) Size
Business Implications of COVID-19 on the Overall Market
Market Share/ Revenue Share (%) of Top Market Players in Total Market Size (2021)
Market Size & Forecast (2018-2029) At Country & Regional Level, By Segments
Overview & Analysis of Key Players Operating in the Market
Global market revenue in 2021 will be derived taking into various micro & macro level factors; along with COVID-19 pandemic
Competitive Analysis
Company Market Share Analysis, 2021 (%)
Supply Chain Analysis
Analysis pertaining to several participants of supply chain such as raw material suppliers, distributors, & OEMs along with others will be highlighted in the study
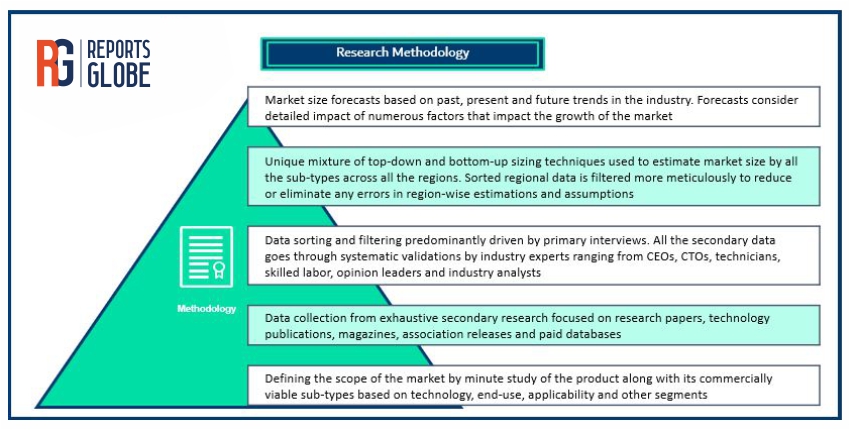
Data Source
Primary & Secondary Research, Internal Data Base & Company Annual Reports
Regions Included
North America, Europe, Asia Pacific, Latin America, & Middle East & Africa
Countries Included
U.S., Canada, U.K., Germany, France, Mexico, Brazil, China, India, Japan, South Korea, UAE, South Africa
Table of Contents:
Chapter 1. Research Methodology & Data Sources
1.1. Data Analysis Models
1.2. Research Scope & Assumptions
1.3. List of Primary & Secondary Data Sources
Chapter 2. Executive Summary
Chapter 3. Pay TV Market: Industry Analysis
3.1. Market segmentation
3.2. Supply chain analysis
3.3. Porter’s 5 forces analysis
3.4. PEST analysis
3.5. Market Dynamics
3.5.1. Market driver analysis
3.5.2. Market restraint analysis
3.5.3. Market opportunity analysis
3.6. Company Market Share Analysis, 2021
Chapter 4. Pay TV Market: Technology Insights
4.1. Global Technology Historic Market Data & Future Forecasts, 2018-2029
4.2. Cable TV
4.2.1. Historic Market Data & Future Forecasts, 2018-2029
4.2.2. Historic Market Data & Future Forecasts by Region, 2018-2029
4.3. Satellite TV
4.3.1. Historic Market Data & Future Forecasts, 2018-2029
4.3.2. Historic Market Data& Future Forecasts, By Region, 2018-2029
4.4. Internet Protocol Television (IPTV)
4.4.1. Historic Market Data & Future Forecasts, 2018-2029
4.4.2. Historic Market Data & Future Forecasts by Region, 2018-2029
Chapter 5. Pay TV Market: Regional Insights
5.1. Global Pay TV Market Data & Future Forecasts, By Region 2018-2029
5.2. North America
5.2.1. Historic Market Data & Future Forecasts, 2018-2029
5.2.2. Historic Market Data & Future Forecasts, By Technology, 2018-2029
5.2.3. U.S.
5.2.3.1. Historic Market Data & Future Forecasts, 2018-2029
5.2.3.2. Historic Market Data & Future Forecasts, By Technology, 2018-2029
5.2.4. Canada
5.2.4.1. Historic Market Data & Future Forecasts, 2018-2029
5.2.4.2. Historic Market Data & Future Forecasts, By Technology, 2018-2029
5.3. Europe
5.3.1. Historic Market Data & Future Forecasts, 2018-2029
5.3.2. Historic Market Data & Future Forecasts, By Technology, 2018-2029
5.3.3. U.K.
5.3.3.1. Historic Market Data & Future Forecasts, 2018-2029
5.3.3.2. Historic Market Data & Future Forecasts, By Technology, 2018-2029
5.3.4. Germany
5.3.4.1. Historic Market Data & Future Forecasts, 2018-2029
5.3.4.2. Historic Market Data & Future Forecasts, By Technology, 2018-2029
5.3.5. France
5.3.5.1. Historic Market Data & Future Forecasts, 2018-2029
5.3.5.2. Historic Market Data & Future Forecasts, By Technology, 2018-2029
5.4. Asia Pacific
5.4.1. Historic Market Data & Future Forecasts, 2018-2029
5.4.2. Historic Market Data & Future Forecasts, By Technology, 2018-2029
5.4.3. China
5.4.3.1. Historic Market Data & Future Forecasts, 2018-2029
5.4.3.2. Historic Market Data & Future Forecasts, By Technology, 2018-2029
5.4.4. India
5.4.4.1. Historic Market Data & Future Forecasts, 2018-2029
5.4.4.2. Historic Market Data & Future Forecasts, By Technology, 2018-2029
5.4.5. Japan
5.4.5.1. Historic Market Data & Future Forecasts, 2018-2029
5.4.5.2. Historic Market Data & Future Forecasts, By Technology, 2018-2029
5.4.6. South Korea
5.4.6.1. Historic Market Data & Future Forecasts, 2018-2029
5.4.6.2. Historic Market Data & Future Forecasts, By Technology, 2018-2029
5.5. Latin America
5.5.1. Historic Market Data & Future Forecasts, 2018-2029
5.5.2. Historic Market Data & Future Forecasts, By Technology, 2018-2029
5.5.3. Brazil
5.5.3.1. Historic Market Data & Future Forecasts, 2018-2029
5.5.3.2. Historic Market Data & Future Forecasts, By Technology, 2018-2029
5.5.4. Mexico
5.5.4.1. Historic Market Data & Future Forecasts, 2018-2029
5.5.4.2. Historic Market Data & Future Forecasts, By Technology, 2018-2029
5.6. Middle East & Africa
5.6.1. Historic Market Data & Future Forecasts, 2018-2029
5.6.2. Historic Market Data & Future Forecasts, By Technology, 2018-2029
5.6.3. UAE
5.6.3.1. Historic Market Data & Future Forecasts, 2018-2029
5.6.3.2. Historic Market Data & Future Forecasts, By Technology, 2018-2029
5.6.4. South Africa
5.6.4.1. Historic Market Data & Future Forecasts, 2018-2029
5.6.4.2. Historic Market Data & Future Forecasts, By Technology, 2018-2029
Chapter 6. Company Profiles
6.1. Company Profiles
6.2. Airtel Digital TV
6.2.1. Company Overview
6.2.2. Financial performance
6.2.3. Product benchmarking
6.2.4. Recent developments
6.3. DIRECTV
6.3.1. Company Overview
6.3.2. Financial performance
6.3.3. Product benchmarking
6.3.4. Recent developments
6.4. DISH Network Corporation
6.4.1. Company Overview
6.4.2. Financial performance
6.4.3. Product benchmarking
6.4.4. Recent developments
6.5. Dish TV India Limited
6.5.1. Company Overview
6.5.2. Financial performance
6.5.3. Product benchmarking
6.5.4. Recent developments
6.6. Fetch TV Pty Ltd.
6.6.1. Company Overview
6.6.2. Financial performance
6.6.3. Product benchmarking
6.6.4. Recent developments
6.7. Foxtel
6.7.1. Company Overview
6.7.2. Financial performance
6.7.3. Product benchmarking
6.7.4. Recent developments
6.8. Rostelecom PJSC
6.8.1. Company Overview
6.8.2. Financial performance
6.8.3. Product benchmarking
6.8.4. Recent developments
6.9. Spectrum
6.9.1. Company Overview
6.9.2. Financial performance
6.9.3. Product benchmarking
6.9.4. Recent developments
6.10. Tata Sky Ltd
6.10.1. Company Overview
6.10.2. Financial performance
6.10.3. Product benchmarking
6.10.4. Recent developments
6.11. Tricolor TV
6.11.1. Company Overview
6.11.2. Financial performance
6.11.3. Product benchmarking
6.11.4. Recent developments
6.12. Videocon d2h ltd
6.12.1. Company Overview
6.12.2. Financial performance
6.12.3. Product benchmarking
6.12.4. Recent developments
6.13. Xfinity
6.13.1. Company Overview
6.13.2. Financial performance
6.13.3. Product benchmarking
6.13.4. Recent developments
List of Tables:
Table 1 Pay TV Market Market Data & Future Forecasts, 2018-2029(USD Billion)
Table 2 Pay TV Market Data & Future Forecasts, By Region, 2018-2029(USD Billion)
Table 3 Pay TV Market Data & Future Forecasts, By Technology, 2018-2029(USD Billion)
Table 4 Cable TV Market Data & Future Forecasts, 2018-2029(USD Billion)
Table 5 Satellite TV Market Data & Future Forecasts, 2018-2029(USD Billion)
Table 6 Internet Protocol Television (IPTV) Market Data & Future Forecasts, 2018-2029(USD Billion)
Table 7 North America Pay TV Market Data & Future Forecasts, 2018-2029(USD Billion)
Table 8 North America Pay TV Market Data & Future Forecasts, By Technology, 2018-2029(USD Billion)
Table 9 U.S. Pay TV Market Data & Future Forecasts, 2018-2029(USD Billion)
Table 10 U.S. Pay TV Market Data & Future Forecasts, By Technology, 2018-2029(USD Billion)
Table 11 Canada Pay TV Market Data & Future Forecasts, 2018-2029(USD Billion)
Table 12 Canada Pay TV Market Data & Future Forecasts, By Technology, 2018-2029(USD Billion)
Table 13 Europe Pay TV Market Data & Future Forecasts, 2018-2029(USD Billion)
Table 14 Europe Pay TV Market Data & Future Forecasts, By Technology, 2018-2029(USD Billion)
Table 15 U.K. Pay TV Market Data & Future Forecasts, 2018-2029(USD Billion)
Table 16 U.K. Market Pay TV Data & Future Forecasts, By Technology, 2018-2029(USD Billion)
Table 17 Germany Pay TV Market Data & Future Forecasts, 2018-2029(USD Billion)
Table 18 Germany Pay TV Market Data & Future Forecasts, By Technology, 2018-2029(USD Billion)
Table 19 France Pay TV Market Data & Future Forecasts, 2018-2029(USD Billion)
Table 20 France Pay TV Market Data & Future Forecasts, By Technology, 2018-2029(USD Billion)
Table 21 Asia Pacific Pay TV Market Data & Future Forecasts, 2018-2029(USD Billion)
Table 22 Asia Pacific Pay TV Market Data & Future Forecasts, By Technology, 2018-2029(USD Billion)
Table 23 China Pay TV Market Data & Future Forecasts, 2018-2029(USD Billion)
Table 24 China Pay TV Market Data & Future Forecasts, By Technology, 2018-2029(USD Billion)
Table 25 India Pay TV Market Data & Future Forecasts, 2018-2029(USD Billion)
Table 26 India Pay TV Market Data & Future Forecasts, By Technology, 2018-2029(USD Billion)
Table 27 Japan Pay TV Market Data & Future Forecasts, 2018-2029(USD Billion)
Table 28 Japan Pay TV Market Data & Future Forecasts, By Technology, 2018-2029(USD Billion)
Table 29 South Korea Pay TV Market Data & Future Forecasts, 2018-2029(USD Billion)
Table 30 South Korea Pay TV Market Data & Future Forecasts, By Technology, 2018-2029(USD Billion)
Table 31 Latin America Pay TV Market Data & Future Forecasts, 2018-2029(USD Billion)
Table 32 Latin America Pay TV Market Data & Future Forecasts, By Technology, 2018-2029(USD Billion)
Table 33 Brazil Pay TV Market Data & Future Forecasts, 2018-2029(USD Billion)
Table 34 Brazil Pay TV Market Data & Future Forecasts, By Technology, 2018-2029(USD Billion)
Table 35 Mexico Pay TV Market Data & Future Forecasts, 2018-2029(USD Billion)
Table 36 Mexico Pay TV Market Data & Future Forecasts, By Technology, 2018-2029(USD Billion)
Table 37 Middle East & Africa Pay TV Market Data & Future Forecasts, 2018-2029(USD Billion)
Table 38 Middle East & Africa Pay TV Market Data & Future Forecasts, By Technology, 2018-2029(USD Billion)
Table 39 UAE Pay TV Market Data & Future Forecasts, 2018-2029(USD Billion)
Table 40 UAE Pay TV Market Data & Future Forecasts, By Technology, 2018-2029(USD Billion)
Table 41 South Africa Pay TV Market Data & Future Forecasts, 2018-2029(USD Billion)
Table 42 South Africa Pay TV Market Data & Future Forecasts, By Technology, 2018-2029(USD Billion)
List of Figures:
Fig.1 Data Analysis Model
Fig.2 Pay TV Market, by 2018-2029(USD Billion)
Fig.3 Pay TV Market Segmentation
Fig.4 Supply chain analysis
Fig.5 Pay TV Market Driver Analysis
Fig.6 Pay TV Market Restraint Analysis
Fig.7 Pay TV Market Opportunity Analysis
Fig.8 Porters 5 Forces Model
Fig.9 PEST Analysis- Pay TV Market
Fig.10 Company Market Share Analysis, 2021
Pay TV market garnered a revenue of USD 219.7 billion in the year 2021 globally and has been foreseen to yield USD 282.8 billion by the year 2029 at a compound annual growth (CAGR) of 3.5% over the forecast period. The market has been observed to be growing at a steady growth rate over the last three years, however with the impact of COVID-19 pandemic globally, the business conditions are expected to change. The market size may reduce significantly or increase with a spike depending on how the value chain has been affected in the entire process.
Players that are operational in the market for a longer period of time are anticipated to absorb the sudden changes, losses and increased operational costs better than those who have recently entered the market. The report focuses on numerous factors that are anticipated to impact the market growth directly and indirectly. The report categorically analyses the growth patterns of different segments based on multiple derivation models.
Both the qualitative and quantitative aspects have been covered under the report. The Pay TV market report includes market size, drivers, restraints, opportunities and trends that will help you understand the market dynamics in detail. Moreover, the report will include market estimates & forecasts in terms of revenue for the overall market along with the segments mentioned in the study. The report focuses on providing a holistic view of the entire market scenario from multiple unmatched detailed analysis mentioned in the report.
What to expect from the report?
Pay TV Total Available Market (TAM)Size
Pay TV Serviceable Available Market (SAM) Size
Business Implications of COVID-19 on the Overall Market
Market Share/ Revenue Share (%) of Top Market Players in Total Market Size (2021)
Market Size & Forecast (2018-2029) At Country & Regional Level, By Segments
Overview & Analysis of Key Players Operating in the Market
Global market revenue in 2021 will be derived taking into various micro & macro level factors; along with COVID-19 pandemic
Competitive Analysis
Company Market Share Analysis, 2021 (%)
Supply Chain Analysis
Analysis pertaining to several participants of supply chain such as raw material suppliers, distributors, & OEMs along with others will be highlighted in the study
Data Source
Primary & Secondary Research, Internal Data Base & Company Annual Reports
Regions Included
North America, Europe, Asia Pacific, Latin America, & Middle East & Africa
Countries Included
U.S., Canada, U.K., Germany, France, Mexico, Brazil, China, India, Japan, South Korea, UAE, South Africa
Table of Contents:
Chapter 1. Research Methodology & Data Sources
1.1. Data Analysis Models
1.2. Research Scope & Assumptions
1.3. List of Primary & Secondary Data Sources
Chapter 2. Executive Summary
Chapter 3. Pay TV Market: Industry Analysis
3.1. Market segmentation
3.2. Supply chain analysis
3.3. Porter’s 5 forces analysis
3.4. PEST analysis
3.5. Market Dynamics
3.5.1. Market driver analysis
3.5.2. Market restraint analysis
3.5.3. Market opportunity analysis
3.6. Company Market Share Analysis, 2021
Chapter 4. Pay TV Market: Technology Insights
4.1. Global Technology Historic Market Data & Future Forecasts, 2018-2029
4.2. Cable TV
4.2.1. Historic Market Data & Future Forecasts, 2018-2029
4.2.2. Historic Market Data & Future Forecasts by Region, 2018-2029
4.3. Satellite TV
4.3.1. Historic Market Data & Future Forecasts, 2018-2029
4.3.2. Historic Market Data& Future Forecasts, By Region, 2018-2029
4.4. Internet Protocol Television (IPTV)
4.4.1. Historic Market Data & Future Forecasts, 2018-2029
4.4.2. Historic Market Data & Future Forecasts by Region, 2018-2029
Chapter 5. Pay TV Market: Regional Insights
5.1. Global Pay TV Market Data & Future Forecasts, By Region 2018-2029
5.2. North America
5.2.1. Historic Market Data & Future Forecasts, 2018-2029
5.2.2. Historic Market Data & Future Forecasts, By Technology, 2018-2029
5.2.3. U.S.
5.2.3.1. Historic Market Data & Future Forecasts, 2018-2029
5.2.3.2. Historic Market Data & Future Forecasts, By Technology, 2018-2029
5.2.4. Canada
5.2.4.1. Historic Market Data & Future Forecasts, 2018-2029
5.2.4.2. Historic Market Data & Future Forecasts, By Technology, 2018-2029
5.3. Europe
5.3.1. Historic Market Data & Future Forecasts, 2018-2029
5.3.2. Historic Market Data & Future Forecasts, By Technology, 2018-2029
5.3.3. U.K.
5.3.3.1. Historic Market Data & Future Forecasts, 2018-2029
5.3.3.2. Historic Market Data & Future Forecasts, By Technology, 2018-2029
5.3.4. Germany
5.3.4.1. Historic Market Data & Future Forecasts, 2018-2029
5.3.4.2. Historic Market Data & Future Forecasts, By Technology, 2018-2029
5.3.5. France
5.3.5.1. Historic Market Data & Future Forecasts, 2018-2029
5.3.5.2. Historic Market Data & Future Forecasts, By Technology, 2018-2029
5.4. Asia Pacific
5.4.1. Historic Market Data & Future Forecasts, 2018-2029
5.4.2. Historic Market Data & Future Forecasts, By Technology, 2018-2029
5.4.3. China
5.4.3.1. Historic Market Data & Future Forecasts, 2018-2029
5.4.3.2. Historic Market Data & Future Forecasts, By Technology, 2018-2029
5.4.4. India
5.4.4.1. Historic Market Data & Future Forecasts, 2018-2029
5.4.4.2. Historic Market Data & Future Forecasts, By Technology, 2018-2029
5.4.5. Japan
5.4.5.1. Historic Market Data & Future Forecasts, 2018-2029
5.4.5.2. Historic Market Data & Future Forecasts, By Technology, 2018-2029
5.4.6. South Korea
5.4.6.1. Historic Market Data & Future Forecasts, 2018-2029
5.4.6.2. Historic Market Data & Future Forecasts, By Technology, 2018-2029
5.5. Latin America
5.5.1. Historic Market Data & Future Forecasts, 2018-2029
5.5.2. Historic Market Data & Future Forecasts, By Technology, 2018-2029
5.5.3. Brazil
5.5.3.1. Historic Market Data & Future Forecasts, 2018-2029
5.5.3.2. Historic Market Data & Future Forecasts, By Technology, 2018-2029
5.5.4. Mexico
5.5.4.1. Historic Market Data & Future Forecasts, 2018-2029
5.5.4.2. Historic Market Data & Future Forecasts, By Technology, 2018-2029
5.6. Middle East & Africa
5.6.1. Historic Market Data & Future Forecasts, 2018-2029
5.6.2. Historic Market Data & Future Forecasts, By Technology, 2018-2029
5.6.3. UAE
5.6.3.1. Historic Market Data & Future Forecasts, 2018-2029
5.6.3.2. Historic Market Data & Future Forecasts, By Technology, 2018-2029
5.6.4. South Africa
5.6.4.1. Historic Market Data & Future Forecasts, 2018-2029
5.6.4.2. Historic Market Data & Future Forecasts, By Technology, 2018-2029
Chapter 6. Company Profiles
6.1. Company Profiles
6.2. Airtel Digital TV
6.2.1. Company Overview
6.2.2. Financial performance
6.2.3. Product benchmarking
6.2.4. Recent developments
6.3. DIRECTV
6.3.1. Company Overview
6.3.2. Financial performance
6.3.3. Product benchmarking
6.3.4. Recent developments
6.4. DISH Network Corporation
6.4.1. Company Overview
6.4.2. Financial performance
6.4.3. Product benchmarking
6.4.4. Recent developments
6.5. Dish TV India Limited
6.5.1. Company Overview
6.5.2. Financial performance
6.5.3. Product benchmarking
6.5.4. Recent developments
6.6. Fetch TV Pty Ltd.
6.6.1. Company Overview
6.6.2. Financial performance
6.6.3. Product benchmarking
6.6.4. Recent developments
6.7. Foxtel
6.7.1. Company Overview
6.7.2. Financial performance
6.7.3. Product benchmarking
6.7.4. Recent developments
6.8. Rostelecom PJSC
6.8.1. Company Overview
6.8.2. Financial performance
6.8.3. Product benchmarking
6.8.4. Recent developments
6.9. Spectrum
6.9.1. Company Overview
6.9.2. Financial performance
6.9.3. Product benchmarking
6.9.4. Recent developments
6.10. Tata Sky Ltd
6.10.1. Company Overview
6.10.2. Financial performance
6.10.3. Product benchmarking
6.10.4. Recent developments
6.11. Tricolor TV
6.11.1. Company Overview
6.11.2. Financial performance
6.11.3. Product benchmarking
6.11.4. Recent developments
6.12. Videocon d2h ltd
6.12.1. Company Overview
6.12.2. Financial performance
6.12.3. Product benchmarking
6.12.4. Recent developments
6.13. Xfinity
6.13.1. Company Overview
6.13.2. Financial performance
6.13.3. Product benchmarking
6.13.4. Recent developments
List of Tables:
Table 1 Pay TV Market Market Data & Future Forecasts, 2018-2029(USD Billion)
Table 2 Pay TV Market Data & Future Forecasts, By Region, 2018-2029(USD Billion)
Table 3 Pay TV Market Data & Future Forecasts, By Technology, 2018-2029(USD Billion)
Table 4 Cable TV Market Data & Future Forecasts, 2018-2029(USD Billion)
Table 5 Satellite TV Market Data & Future Forecasts, 2018-2029(USD Billion)
Table 6 Internet Protocol Television (IPTV) Market Data & Future Forecasts, 2018-2029(USD Billion)
Table 7 North America Pay TV Market Data & Future Forecasts, 2018-2029(USD Billion)
Table 8 North America Pay TV Market Data & Future Forecasts, By Technology, 2018-2029(USD Billion)
Table 9 U.S. Pay TV Market Data & Future Forecasts, 2018-2029(USD Billion)
Table 10 U.S. Pay TV Market Data & Future Forecasts, By Technology, 2018-2029(USD Billion)
Table 11 Canada Pay TV Market Data & Future Forecasts, 2018-2029(USD Billion)
Table 12 Canada Pay TV Market Data & Future Forecasts, By Technology, 2018-2029(USD Billion)
Table 13 Europe Pay TV Market Data & Future Forecasts, 2018-2029(USD Billion)
Table 14 Europe Pay TV Market Data & Future Forecasts, By Technology, 2018-2029(USD Billion)
Table 15 U.K. Pay TV Market Data & Future Forecasts, 2018-2029(USD Billion)
Table 16 U.K. Market Pay TV Data & Future Forecasts, By Technology, 2018-2029(USD Billion)
Table 17 Germany Pay TV Market Data & Future Forecasts, 2018-2029(USD Billion)
Table 18 Germany Pay TV Market Data & Future Forecasts, By Technology, 2018-2029(USD Billion)
Table 19 France Pay TV Market Data & Future Forecasts, 2018-2029(USD Billion)
Table 20 France Pay TV Market Data & Future Forecasts, By Technology, 2018-2029(USD Billion)
Table 21 Asia Pacific Pay TV Market Data & Future Forecasts, 2018-2029(USD Billion)
Table 22 Asia Pacific Pay TV Market Data & Future Forecasts, By Technology, 2018-2029(USD Billion)
Table 23 China Pay TV Market Data & Future Forecasts, 2018-2029(USD Billion)
Table 24 China Pay TV Market Data & Future Forecasts, By Technology, 2018-2029(USD Billion)
Table 25 India Pay TV Market Data & Future Forecasts, 2018-2029(USD Billion)
Table 26 India Pay TV Market Data & Future Forecasts, By Technology, 2018-2029(USD Billion)
Table 27 Japan Pay TV Market Data & Future Forecasts, 2018-2029(USD Billion)
Table 28 Japan Pay TV Market Data & Future Forecasts, By Technology, 2018-2029(USD Billion)
Table 29 South Korea Pay TV Market Data & Future Forecasts, 2018-2029(USD Billion)
Table 30 South Korea Pay TV Market Data & Future Forecasts, By Technology, 2018-2029(USD Billion)
Table 31 Latin America Pay TV Market Data & Future Forecasts, 2018-2029(USD Billion)
Table 32 Latin America Pay TV Market Data & Future Forecasts, By Technology, 2018-2029(USD Billion)
Table 33 Brazil Pay TV Market Data & Future Forecasts, 2018-2029(USD Billion)
Table 34 Brazil Pay TV Market Data & Future Forecasts, By Technology, 2018-2029(USD Billion)
Table 35 Mexico Pay TV Market Data & Future Forecasts, 2018-2029(USD Billion)
Table 36 Mexico Pay TV Market Data & Future Forecasts, By Technology, 2018-2029(USD Billion)
Table 37 Middle East & Africa Pay TV Market Data & Future Forecasts, 2018-2029(USD Billion)
Table 38 Middle East & Africa Pay TV Market Data & Future Forecasts, By Technology, 2018-2029(USD Billion)
Table 39 UAE Pay TV Market Data & Future Forecasts, 2018-2029(USD Billion)
Table 40 UAE Pay TV Market Data & Future Forecasts, By Technology, 2018-2029(USD Billion)
Table 41 South Africa Pay TV Market Data & Future Forecasts, 2018-2029(USD Billion)
Table 42 South Africa Pay TV Market Data & Future Forecasts, By Technology, 2018-2029(USD Billion)
List of Figures:
Fig.1 Data Analysis Model
Fig.2 Pay TV Market, by 2018-2029(USD Billion)
Fig.3 Pay TV Market Segmentation
Fig.4 Supply chain analysis
Fig.5 Pay TV Market Driver Analysis
Fig.6 Pay TV Market Restraint Analysis
Fig.7 Pay TV Market Opportunity Analysis
Fig.8 Porters 5 Forces Model
Fig.9 PEST Analysis- Pay TV Market
Fig.10 Company Market Share Analysis, 2021
Pay TV Market Segmentation:
Pay TV Market, By Technology (2018-2029)
Cable TV
Satellite TV
Internet Protocol Television (IPTV)
Pay TV Market, By Region (2018-2029)
North America
U.S.
Canada
Europe
U.K.
Germany
France
Asia Pacific
China
India
Japan
South Korea
Latin America
Brazil
Mexico
Middle East & Africa
UAE
South Africa
Major Players Operating in the Pay TV Market:
Airtel Digital TV
DIRECTV
Dish TV India Limited
DISH Network Corporation
Fetch TV Pty Ltd.
Foxtel
Rostelecom PJSC
Spectrum
Tata Sky Ltd
Tricolor TV
Videocon d2h ltd
Xfinity
Frequently Asked Questions About This Report
Choose License Type
Each market study on Reports Globe will be revised based on COVID-19 impact analysis
How can we help you?
Our salient features
Best Solution
We will help you understand value propositions of various reports across numerous domains and suggest the best possible solution to suffice your research needs.
Customized Research
Our team of analysts and consultants provide assistance for customized research requirements
Max ROI
Guaranteed maximum assistance to help you get your reports at the optimum prices, thereby ensuring maximum returns on investment.
24/7 Support
24X7 availability to help you through the buying process as well as answer any of your doubts.