The Optical Liquid Level Sensors Market has been growing at a faster pace with significant growth rates during the last few years and is anticipated to grow significantly in the forecast period from 2022 to 2029.
The prime objective of this report is to help the user understand the market in terms of its definition, segmentation, market potential, influential trends, and the challenges that the market is facing with 10 major regions and 30 major countries. Deep researches and analysis were done during the preparation of the report. The readers will find this report very helpful in understanding the market in depth. The data and the information regarding the market are taken from reliable sources such as websites, annual reports of the companies, journals, and others and were checked and validated by the industry experts. The facts and data are represented in the report using diagrams, graphs, pie charts, and other pictorial representations. This enhances the visual representation and also helps in understanding the facts much better.
By Market Players:
Gems Sensors & Control Co.
Cynergy 3 (Sensata Technologies)
Siemens AG
Honeywell International, Inc.
Shenzhen EPT Technology
OMEGA Engineering Inc.
Yamamoto Electric Industrial Co.,Ltd.
First Sensor
SST Sensing Ltd.
Automation Products Group, Inc.
By Type:
Open Drain
Push-Pull
By Application:
Oil & Liquefied Petroleum Gas (LPG)
Chemicals
Automotive & Transportation
Power & Manufacturing
Others
By Regions/Countries:
North America
United States
Canada
Mexico
East Asia
China
Japan
South Korea
Europe
Germany
United Kingdom
France
Italy
South Asia
India
Southeast Asia
Indonesia
Thailand
Singapore
Middle East
Turkey
Saudi Arabia
Iran
Africa
Nigeria
South Africa
Oceania
Australia
South America
Points Covered in The Report:
The points that are discussed within the report are the major market players that are involved in the market such as market players, raw material suppliers, equipment suppliers, end users, traders, distributors and etc.
The complete profile of the companies is mentioned. And the capacity, production, price, revenue, cost, gross, gross margin, sales volume, sales revenue, consumption, growth rate, import, export, supply, future strategies, and the technological developments that they are making are also included within the report. This report analyzed 12 years data history and forecast.
The growth factors of the market is discussed in detail wherein the different end users of the market are explained in detail.
Data and information by market player, by region, by type, by application and etc, and custom research can be added according to specific requirements.
The report contains the SWOT analysis of the market. Finally, the report contains the conclusion part where the opinions of the industrial experts are included.
Key Reasons to Purchase:
To gain insightful analyses of the market and have comprehensive understanding of the global market and its commercial landscape.
Assess the production processes, major issues, and solutions to mitigate the development risk.
To understand the most affecting driving and restraining forces in the market and its impact in the global market.
Learn about the market strategies that are being adopted by leading respective organizations.
To understand the future outlook and prospects for the market.
Besides the standard structure reports, we also provide custom research according to specific requirements.
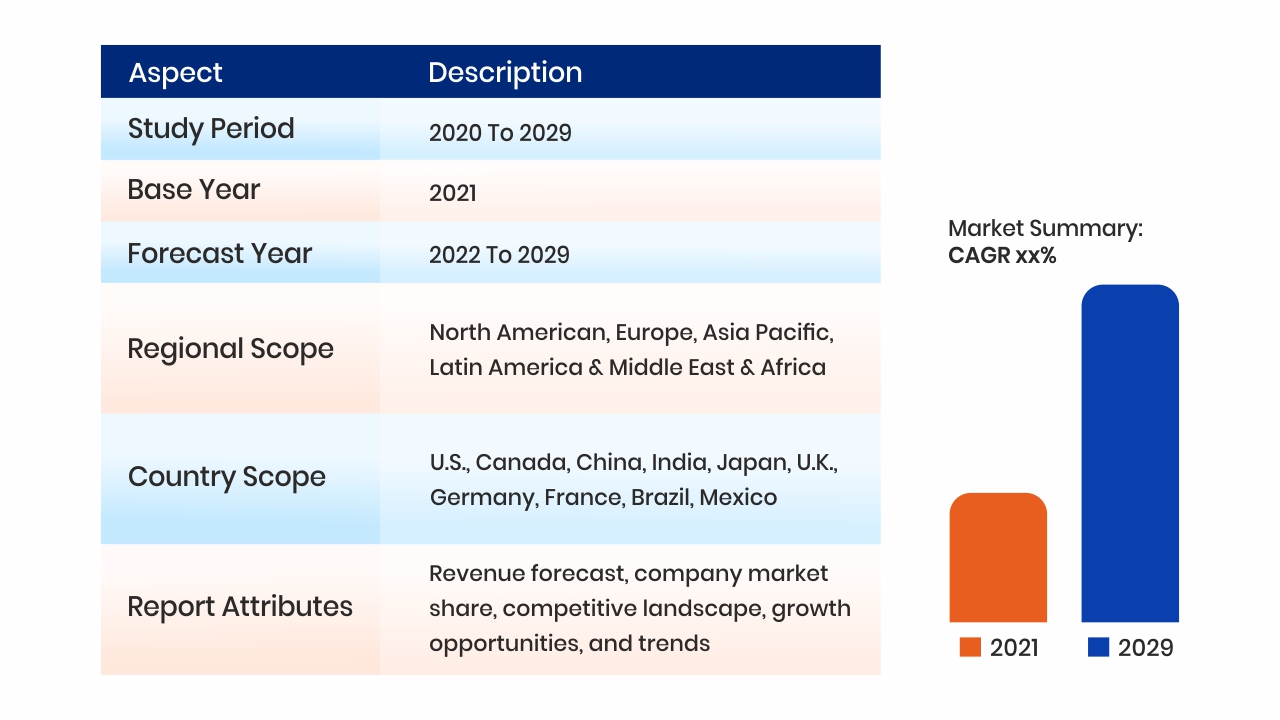
The report focuses on Global, Top 10 Regions and Top 50 Countries Market Size of Optical Liquid Level Sensors 2018-2021, and development forecast 2022-2029 including industries, major players/suppliers worldwide and market share by regions, with company and product introduction, position in the market including their market status and development trend by types and applications which will provide its price and profit status, and marketing status & market growth drivers and challenges, with base year as 2021.
Key Indicators Analysed:
Market Players & Competitor Analysis: The report covers the key players of the industry including Company Profile, Product Specifications, Production Capacity/Sales, Revenue, Price and Gross Margin 2018-2020 & Sales by Product Types.
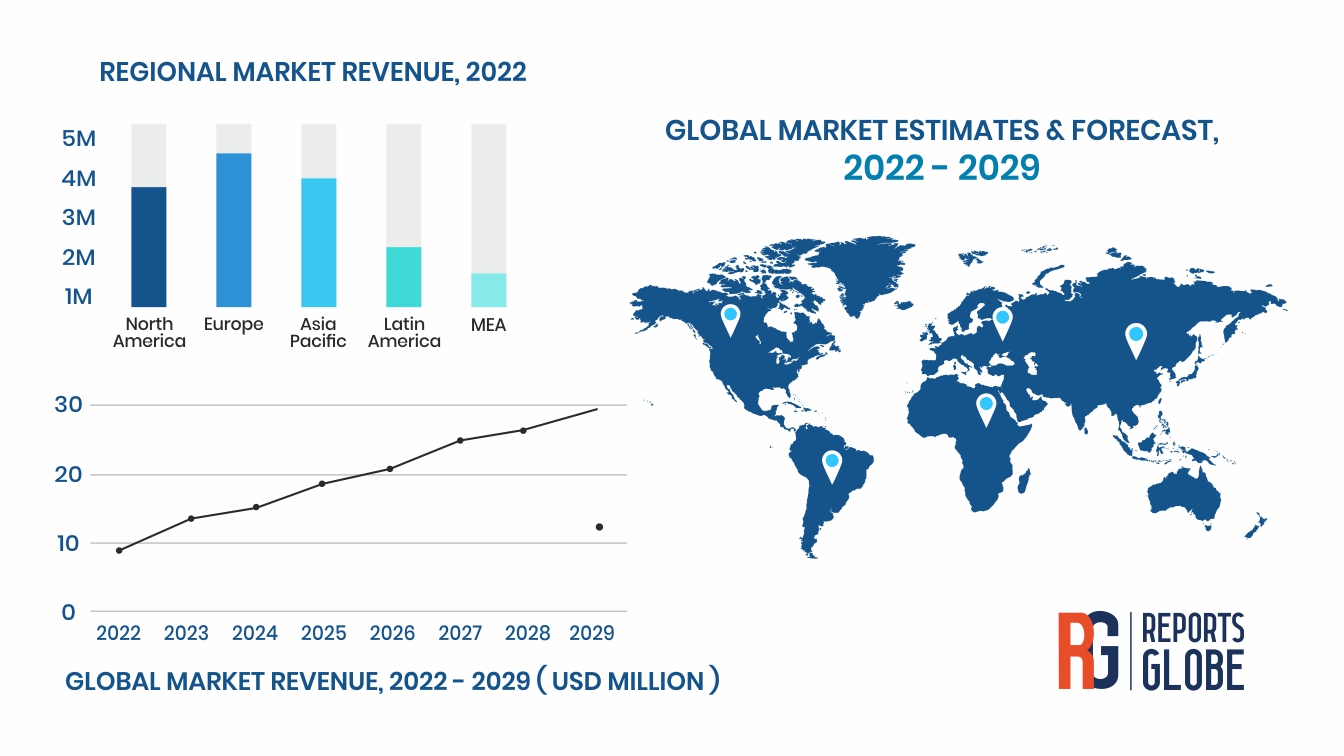
Global and Regional Market Analysis: The report includes Global & Regional market status and outlook 2022-2029. Further the report provides break down details about each region & countries covered in the report. Identifying its production, consumption, import & export, sales volume & revenue forecast.
Market Analysis by Product Type: The report covers majority Product Types in the Optical Liquid Level Sensors Industry, including its product specifications by each key player, volume, sales by Volume and Value (M USD).
Market Analysis by Application Type: Based on the Optical Liquid Level Sensors Industry and its applications, the market is further sub-segmented into several major Application of its industry. It provides you with the market size, CAGR & forecast by each industry applications.
Market Trends: Market key trends which include Increased Competition and Continuous Innovations.
Opportunities and Drivers: Identifying the Growing Demands and New Technology
Porters Five Force Analysis: The report will provide with the state of competition in industry depending on five basic forces: threat of new entrants, bargaining power of suppliers, bargaining power of buyers, threat of substitute products or services, and existing industry rivalry.
COVID-19 Impact:
Report covers Impact of Coronavirus COVID-19: Since the COVID-19 virus outbreak in December 2019, the disease has spread to almost every country around the globe with the World Health Organization declaring it a public health emergency. The global impacts of the coronavirus disease 2019 (COVID-19) are already starting to be felt, and will significantly affect the Optical Liquid Level Sensors market in 2020. The outbreak of COVID-19 has brought effects on many aspects, like flight cancellations; travel bans and quarantines; restaurants closed; all indoor/outdoor events restricted; over forty countries state of emergency declared; massive slowing of the supply chain; stock market volatility; falling business confidence, growing panic among the population, and uncertainty about future.
1 Market Overview
1.1 Optical Liquid Level Sensors Introduction
1.2 Market Analysis by Type
1.2.1 Overview: Global Optical Liquid Level Sensors Revenue by Type: 2018 Versus 2021
1.2.2 Open Drain
1.2.3 Push-Pull
1.3 Market Analysis by Application
1.3.1 Overview: Global Optical Liquid Level Sensors Revenue by Application: 2018-2021
1.3.2 Oil & Liquefied Petroleum Gas (LPG)
1.3.3 Chemicals
1.3.4 Automotive & Transportation
1.3.5 Power & Manufacturing
1.3.6 Others
1.4 Overview of Global Optical Liquid Level Sensors Market
1.4.1 Global Optical Liquid Level Sensors Market Status and Outlook (2018-2029)
1.4.2 North America
1.4.3 East Asia
1.4.4 Europe
1.4.5 South Asia
1.4.6 Southeast Asia
1.4.7 Middle East
1.4.8 Africa
1.4.9 Oceania
1.4.10 South America
1.4.11 Rest of the World
1.5 COVID-19 Outbreak: Optical Liquid Level Sensors Industry Impact
1.5.1 COVID-19 Potential Implications for the Optical Liquid Level Sensors
1.5.2 Growth Opportunities Analysis in Covid-19 Crisis
1.5.3 Market Risk and Restraints
1.5.4 Market Growth Drivers
1.6 Leading Market Players Recent Reaction to COVID-19
1.7 Recent Market Price Analysis Reaction to COVID-19
1.8 Key Countries Responses to COVID-19 Outbreak
2 Company Profiles and Key Figures in Optical Liquid Level Sensors Business
2.1 Gems Sensors & Control Co.
2.1.1 Gems Sensors & Control Co. Company Profile
2.1.2 Gems Sensors & Control Co. Optical Liquid Level Sensors Product Specification
2.1.3 Gems Sensors & Control Co. Optical Liquid Level Sensors Production Capacity, Revenue, Price and Gross Margin (2018-2021)
2.2 Cynergy 3 (Sensata Technologies)
2.2.1 Cynergy 3 (Sensata Technologies) Company Profile
2.2.2 Cynergy 3 (Sensata Technologies) Optical Liquid Level Sensors Product Specification
2.2.3 Cynergy 3 (Sensata Technologies) Optical Liquid Level Sensors Production Capacity, Revenue, Price and Gross Margin (2018-2021)
2.3 Siemens AG
2.3.1 Siemens AG Company Profile
2.3.2 Siemens AG Optical Liquid Level Sensors Product Specification
2.3.3 Siemens AG Optical Liquid Level Sensors Production Capacity, Revenue, Price and Gross Margin (2018-2021)
2.4 Honeywell International, Inc.
2.4.1 Honeywell International, Inc. Company Profile
2.4.2 Honeywell International, Inc. Optical Liquid Level Sensors Product Specification
2.4.3 Honeywell International, Inc. Optical Liquid Level Sensors Production Capacity, Revenue, Price and Gross Margin (2018-2021)
2.5 Shenzhen EPT Technology
2.5.1 Shenzhen EPT Technology Company Profile
2.5.2 Shenzhen EPT Technology Optical Liquid Level Sensors Product Specification
2.5.3 Shenzhen EPT Technology Optical Liquid Level Sensors Production Capacity, Revenue, Price and Gross Margin (2018-2021)
2.6 OMEGA Engineering Inc.
2.6.1 OMEGA Engineering Inc. Company Profile
2.6.2 OMEGA Engineering Inc. Optical Liquid Level Sensors Product Specification
2.6.3 OMEGA Engineering Inc. Optical Liquid Level Sensors Production Capacity, Revenue, Price and Gross Margin (2018-2021)
2.7 Yamamoto Electric Industrial Co.,Ltd.
2.7.1 Yamamoto Electric Industrial Co.,Ltd. Company Profile
2.7.2 Yamamoto Electric Industrial Co.,Ltd. Optical Liquid Level Sensors Product Specification
2.7.3 Yamamoto Electric Industrial Co.,Ltd. Optical Liquid Level Sensors Production Capacity, Revenue, Price and Gross Margin (2018-2021)
2.8 First Sensor
2.8.1 First Sensor Company Profile
2.8.2 First Sensor Optical Liquid Level Sensors Product Specification
2.8.3 First Sensor Optical Liquid Level Sensors Production Capacity, Revenue, Price and Gross Margin (2018-2021)
2.9 SST Sensing Ltd.
2.9.1 SST Sensing Ltd. Company Profile
2.9.2 SST Sensing Ltd. Optical Liquid Level Sensors Product Specification
2.9.3 SST Sensing Ltd. Optical Liquid Level Sensors Production Capacity, Revenue, Price and Gross Margin (2018-2021)
2.10 Automation Products Group, Inc.
2.10.1 Automation Products Group, Inc. Company Profile
2.10.2 Automation Products Group, Inc. Optical Liquid Level Sensors Product Specification
2.10.3 Automation Products Group, Inc. Optical Liquid Level Sensors Production Capacity, Revenue, Price and Gross Margin (2018-2021)
3 Sales, Revenue and Market Share by Manufacturer
3.1 Global Optical Liquid Level Sensors Sales and Market Share by Manufacturer (2018-2021)
3.2 Global Optical Liquid Level Sensors Revenue and Market Share by Manufacturer (2018-2021)
3.3 Market Competition Trend
4 Sales by Region
4.1 Global Optical Liquid Level Sensors Sales Volume Market Share by Region (2018-2021)
4.2 Global Optical Liquid Level Sensors Sales Revenue Market Share by Region (2018-2021)
4.3 North America Optical Liquid Level Sensors Sales Volume
4.3.1 North America Optical Liquid Level Sensors Sales Volume Growth Rate (2018-2021)
4.3.2 North America Optical Liquid Level Sensors Sales Volume Capacity, Revenue, Price and Gross Margin (2018-2021)
4.4 East Asia Optical Liquid Level Sensors Sales Volume
4.4.1 East Asia Optical Liquid Level Sensors Sales Volume Growth Rate (2018-2021)
4.4.2 East Asia Optical Liquid Level Sensors Sales Volume Capacity, Revenue, Price and Gross Margin (2018-2021)
4.5 Europe Optical Liquid Level Sensors Sales Volume (2018-2021)
4.5.1 Europe Optical Liquid Level Sensors Sales Volume Growth Rate (2018-2021)
4.5.2 Europe Optical Liquid Level Sensors Sales Volume Capacity, Revenue, Price and Gross Margin (2018-2021)
4.6 South Asia Optical Liquid Level Sensors Sales Volume (2018-2021)
4.6.1 South Asia Optical Liquid Level Sensors Sales Volume Growth Rate (2018-2021)
4.6.2 South Asia Optical Liquid Level Sensors Sales Volume Capacity, Revenue, Price and Gross Margin (2018-2021)
4.7 Southeast Asia Optical Liquid Level Sensors Sales Volume (2018-2021)
4.7.1 Southeast Asia Optical Liquid Level Sensors Sales Volume Growth Rate (2018-2021)
4.7.2 Southeast Asia Optical Liquid Level Sensors Sales Volume Capacity, Revenue, Price and Gross Margin (2018-2021)
4.8 Middle East Optical Liquid Level Sensors Sales Volume (2018-2021)
4.8.1 Middle East Optical Liquid Level Sensors Sales Volume Growth Rate (2018-2021)
4.8.2 Middle East Optical Liquid Level Sensors Sales Volume Capacity, Revenue, Price and Gross Margin (2018-2021)
4.9 Africa Optical Liquid Level Sensors Sales Volume (2018-2021)
4.9.1 Africa Optical Liquid Level Sensors Sales Volume Growth Rate (2018-2021)
4.9.2 Africa Optical Liquid Level Sensors Sales Volume Capacity, Revenue, Price and Gross Margin (2018-2021)
4.10 Oceania Optical Liquid Level Sensors Sales Volume (2018-2021)
4.10.1 Oceania Optical Liquid Level Sensors Sales Volume Growth Rate (2018-2021)
4.10.2 Oceania Optical Liquid Level Sensors Sales Volume Capacity, Revenue, Price and Gross Margin (2018-2021)
4.11 South America Optical Liquid Level Sensors Sales Volume (2018-2021)
4.11.1 South America Optical Liquid Level Sensors Sales Volume Growth Rate (2018-2021)
4.11.2 South America Optical Liquid Level Sensors Sales Volume Capacity, Revenue, Price and Gross Margin (2018-2021)
4.12 Rest of the World Optical Liquid Level Sensors Sales Volume (2018-2021)
4.12.1 Rest of the World Optical Liquid Level Sensors Sales Volume Growth Rate (2018-2021)
4.12.2 Rest of the World Optical Liquid Level Sensors Sales Volume Capacity, Revenue, Price and Gross Margin (2018-2021)
5 North America
5.1 North America Optical Liquid Level Sensors Consumption by Countries
5.2 United States
5.3 Canada
5.4 Mexico
6 East Asia
6.1 East Asia Optical Liquid Level Sensors Consumption by Countries
6.2 China
6.3 Japan
6.4 South Korea
7 Europe
7.1 Europe Optical Liquid Level Sensors Consumption by Countries
7.2 Germany
7.3 United Kingdom
7.4 France
7.5 Italy
7.6 Russia
7.7 Spain
7.8 Netherlands
7.9 Switzerland
7.10 Poland
8 South Asia
8.1 South Asia Optical Liquid Level Sensors Consumption by Countries
8.2 India
8.3 Pakistan
8.4 Bangladesh
9 Southeast Asia
9.1 Southeast Asia Optical Liquid Level Sensors Consumption by Countries
9.2 Indonesia
9.3 Thailand
9.4 Singapore
9.5 Malaysia
9.6 Philippines
9.7 Vietnam
9.8 Myanmar
10 Middle East
10.1 Middle East Optical Liquid Level Sensors Consumption by Countries
10.2 Turkey
10.3 Saudi Arabia
10.4 Iran
10.5 United Arab Emirates
10.6 Israel
10.7 Iraq
10.8 Qatar
10.9 Kuwait
10.10 Oman
11 Africa
11.1 Africa Optical Liquid Level Sensors Consumption by Countries
11.2 Nigeria
11.3 South Africa
11.4 Egypt
11.5 Algeria
11.6 Morocco
12 Oceania
12.1 Oceania Optical Liquid Level Sensors Consumption by Countries
12.2 Australia
12.3 New Zealand
13 South America
13.1 South America Optical Liquid Level Sensors Consumption by Countries
13.2 Brazil
13.3 Argentina
13.4 Columbia
13.5 Chile
13.6 Venezuela
13.7 Peru
13.8 Puerto Rico
13.9 Ecuador
14 Rest of the World
14.1 Rest of the World Optical Liquid Level Sensors Consumption by Countries
14.2 Kazakhstan
15 Sales Volume, Sales Revenue, Sales Price Trend by Type
15.1 Global Optical Liquid Level Sensors Sales Volume Market Share by Type (2018-2021)
15.2 Global Optical Liquid Level Sensors Sales Revenue Market Share by Type (2018-2021)
15.3 Global Optical Liquid Level Sensors Sales Price by Type (2018-2021)
16 Consumption Analysis by Application
16.1 Global Optical Liquid Level Sensors Consumption Volume by Application (2018-2021)
16.2 Global Optical Liquid Level Sensors Consumption Value by Application (2018-2021)
17 Production and Supply Forecast
17.1 Global Forecasted Production of Optical Liquid Level Sensors (2022-2029)
17.2 Global Forecasted Revenue of Optical Liquid Level Sensors (2022-2029)
17.3 Global Forecasted Price of Optical Liquid Level Sensors (2018-2029)
17.4 Global Forecasted Production of Optical Liquid Level Sensors by Region (2022-2029)
17.4.1 North America Optical Liquid Level Sensors Production, Revenue Forecast (2022-2029)
17.4.2 East Asia Optical Liquid Level Sensors Production, Revenue Forecast (2022-2029)
17.4.3 Europe Optical Liquid Level Sensors Production, Revenue Forecast (2022-2029)
17.4.4 South Asia Optical Liquid Level Sensors Production, Revenue Forecast (2022-2029)
17.4.5 Southeast Asia Optical Liquid Level Sensors Production, Revenue Forecast (2022-2029)
17.4.6 Middle East Optical Liquid Level Sensors Production, Revenue Forecast (2022-2029)
17.4.7 Africa Optical Liquid Level Sensors Production, Revenue Forecast (2022-2029)
17.4.8 Oceania Optical Liquid Level Sensors Production, Revenue Forecast (2022-2029)
17.4.9 South America Optical Liquid Level Sensors Production, Revenue Forecast (2022-2029)
17.4.10 Rest of the World Optical Liquid Level Sensors Production, Revenue Forecast (2022-2029)
17.5 Forecast by Type and by Application (2022-2029)
17.5.1 Global Sales Volume, Sales Revenue and Sales Price Forecast by Type (2022-2029)
17.5.2 Global Forecasted Consumption of Optical Liquid Level Sensors by Application (2022-2029)
18 Sales Channel, Distributors, Traders and Dealers
18.1 Sales Channel
18.1.1 Direct Channel
18.1.2 Indirect Channel
18.2 Distributors, Traders and Dealers
19 Research Findings and Conclusion
20 Appendix
20.1 Methodology
20.2 Data Source
20.3 Disclaimer
20.4 About US
The Optical Liquid Level Sensors Market has been growing at a faster pace with significant growth rates during the last few years and is anticipated to grow significantly in the forecast period from 2022 to 2029.
The prime objective of this report is to help the user understand the market in terms of its definition, segmentation, market potential, influential trends, and the challenges that the market is facing with 10 major regions and 30 major countries. Deep researches and analysis were done during the preparation of the report. The readers will find this report very helpful in understanding the market in depth. The data and the information regarding the market are taken from reliable sources such as websites, annual reports of the companies, journals, and others and were checked and validated by the industry experts. The facts and data are represented in the report using diagrams, graphs, pie charts, and other pictorial representations. This enhances the visual representation and also helps in understanding the facts much better.
By Market Players:
Gems Sensors & Control Co.
Cynergy 3 (Sensata Technologies)
Siemens AG
Honeywell International, Inc.
Shenzhen EPT Technology
OMEGA Engineering Inc.
Yamamoto Electric Industrial Co.,Ltd.
First Sensor
SST Sensing Ltd.
Automation Products Group, Inc.
By Type:
Open Drain
Push-Pull
By Application:
Oil & Liquefied Petroleum Gas (LPG)
Chemicals
Automotive & Transportation
Power & Manufacturing
Others
By Regions/Countries:
North America
United States
Canada
Mexico
East Asia
China
Japan
South Korea
Europe
Germany
United Kingdom
France
Italy
South Asia
India
Southeast Asia
Indonesia
Thailand
Singapore
Middle East
Turkey
Saudi Arabia
Iran
Africa
Nigeria
South Africa
Oceania
Australia
South America
Points Covered in The Report:
The points that are discussed within the report are the major market players that are involved in the market such as market players, raw material suppliers, equipment suppliers, end users, traders, distributors and etc.
The complete profile of the companies is mentioned. And the capacity, production, price, revenue, cost, gross, gross margin, sales volume, sales revenue, consumption, growth rate, import, export, supply, future strategies, and the technological developments that they are making are also included within the report. This report analyzed 12 years data history and forecast.
The growth factors of the market is discussed in detail wherein the different end users of the market are explained in detail.
Data and information by market player, by region, by type, by application and etc, and custom research can be added according to specific requirements.
The report contains the SWOT analysis of the market. Finally, the report contains the conclusion part where the opinions of the industrial experts are included.
Key Reasons to Purchase:
To gain insightful analyses of the market and have comprehensive understanding of the global market and its commercial landscape.
Assess the production processes, major issues, and solutions to mitigate the development risk.
To understand the most affecting driving and restraining forces in the market and its impact in the global market.
Learn about the market strategies that are being adopted by leading respective organizations.
To understand the future outlook and prospects for the market.
Besides the standard structure reports, we also provide custom research according to specific requirements.
The report focuses on Global, Top 10 Regions and Top 50 Countries Market Size of Optical Liquid Level Sensors 2018-2021, and development forecast 2022-2029 including industries, major players/suppliers worldwide and market share by regions, with company and product introduction, position in the market including their market status and development trend by types and applications which will provide its price and profit status, and marketing status & market growth drivers and challenges, with base year as 2021.
Key Indicators Analysed:
Market Players & Competitor Analysis: The report covers the key players of the industry including Company Profile, Product Specifications, Production Capacity/Sales, Revenue, Price and Gross Margin 2018-2020 & Sales by Product Types.
Global and Regional Market Analysis: The report includes Global & Regional market status and outlook 2022-2029. Further the report provides break down details about each region & countries covered in the report. Identifying its production, consumption, import & export, sales volume & revenue forecast.
Market Analysis by Product Type: The report covers majority Product Types in the Optical Liquid Level Sensors Industry, including its product specifications by each key player, volume, sales by Volume and Value (M USD).
Market Analysis by Application Type: Based on the Optical Liquid Level Sensors Industry and its applications, the market is further sub-segmented into several major Application of its industry. It provides you with the market size, CAGR & forecast by each industry applications.
Market Trends: Market key trends which include Increased Competition and Continuous Innovations.
Opportunities and Drivers: Identifying the Growing Demands and New Technology
Porters Five Force Analysis: The report will provide with the state of competition in industry depending on five basic forces: threat of new entrants, bargaining power of suppliers, bargaining power of buyers, threat of substitute products or services, and existing industry rivalry.
COVID-19 Impact:
Report covers Impact of Coronavirus COVID-19: Since the COVID-19 virus outbreak in December 2019, the disease has spread to almost every country around the globe with the World Health Organization declaring it a public health emergency. The global impacts of the coronavirus disease 2019 (COVID-19) are already starting to be felt, and will significantly affect the Optical Liquid Level Sensors market in 2020. The outbreak of COVID-19 has brought effects on many aspects, like flight cancellations; travel bans and quarantines; restaurants closed; all indoor/outdoor events restricted; over forty countries state of emergency declared; massive slowing of the supply chain; stock market volatility; falling business confidence, growing panic among the population, and uncertainty about future.
1 Market Overview
1.1 Optical Liquid Level Sensors Introduction
1.2 Market Analysis by Type
1.2.1 Overview: Global Optical Liquid Level Sensors Revenue by Type: 2018 Versus 2021
1.2.2 Open Drain
1.2.3 Push-Pull
1.3 Market Analysis by Application
1.3.1 Overview: Global Optical Liquid Level Sensors Revenue by Application: 2018-2021
1.3.2 Oil & Liquefied Petroleum Gas (LPG)
1.3.3 Chemicals
1.3.4 Automotive & Transportation
1.3.5 Power & Manufacturing
1.3.6 Others
1.4 Overview of Global Optical Liquid Level Sensors Market
1.4.1 Global Optical Liquid Level Sensors Market Status and Outlook (2018-2029)
1.4.2 North America
1.4.3 East Asia
1.4.4 Europe
1.4.5 South Asia
1.4.6 Southeast Asia
1.4.7 Middle East
1.4.8 Africa
1.4.9 Oceania
1.4.10 South America
1.4.11 Rest of the World
1.5 COVID-19 Outbreak: Optical Liquid Level Sensors Industry Impact
1.5.1 COVID-19 Potential Implications for the Optical Liquid Level Sensors
1.5.2 Growth Opportunities Analysis in Covid-19 Crisis
1.5.3 Market Risk and Restraints
1.5.4 Market Growth Drivers
1.6 Leading Market Players Recent Reaction to COVID-19
1.7 Recent Market Price Analysis Reaction to COVID-19
1.8 Key Countries Responses to COVID-19 Outbreak
2 Company Profiles and Key Figures in Optical Liquid Level Sensors Business
2.1 Gems Sensors & Control Co.
2.1.1 Gems Sensors & Control Co. Company Profile
2.1.2 Gems Sensors & Control Co. Optical Liquid Level Sensors Product Specification
2.1.3 Gems Sensors & Control Co. Optical Liquid Level Sensors Production Capacity, Revenue, Price and Gross Margin (2018-2021)
2.2 Cynergy 3 (Sensata Technologies)
2.2.1 Cynergy 3 (Sensata Technologies) Company Profile
2.2.2 Cynergy 3 (Sensata Technologies) Optical Liquid Level Sensors Product Specification
2.2.3 Cynergy 3 (Sensata Technologies) Optical Liquid Level Sensors Production Capacity, Revenue, Price and Gross Margin (2018-2021)
2.3 Siemens AG
2.3.1 Siemens AG Company Profile
2.3.2 Siemens AG Optical Liquid Level Sensors Product Specification
2.3.3 Siemens AG Optical Liquid Level Sensors Production Capacity, Revenue, Price and Gross Margin (2018-2021)
2.4 Honeywell International, Inc.
2.4.1 Honeywell International, Inc. Company Profile
2.4.2 Honeywell International, Inc. Optical Liquid Level Sensors Product Specification
2.4.3 Honeywell International, Inc. Optical Liquid Level Sensors Production Capacity, Revenue, Price and Gross Margin (2018-2021)
2.5 Shenzhen EPT Technology
2.5.1 Shenzhen EPT Technology Company Profile
2.5.2 Shenzhen EPT Technology Optical Liquid Level Sensors Product Specification
2.5.3 Shenzhen EPT Technology Optical Liquid Level Sensors Production Capacity, Revenue, Price and Gross Margin (2018-2021)
2.6 OMEGA Engineering Inc.
2.6.1 OMEGA Engineering Inc. Company Profile
2.6.2 OMEGA Engineering Inc. Optical Liquid Level Sensors Product Specification
2.6.3 OMEGA Engineering Inc. Optical Liquid Level Sensors Production Capacity, Revenue, Price and Gross Margin (2018-2021)
2.7 Yamamoto Electric Industrial Co.,Ltd.
2.7.1 Yamamoto Electric Industrial Co.,Ltd. Company Profile
2.7.2 Yamamoto Electric Industrial Co.,Ltd. Optical Liquid Level Sensors Product Specification
2.7.3 Yamamoto Electric Industrial Co.,Ltd. Optical Liquid Level Sensors Production Capacity, Revenue, Price and Gross Margin (2018-2021)
2.8 First Sensor
2.8.1 First Sensor Company Profile
2.8.2 First Sensor Optical Liquid Level Sensors Product Specification
2.8.3 First Sensor Optical Liquid Level Sensors Production Capacity, Revenue, Price and Gross Margin (2018-2021)
2.9 SST Sensing Ltd.
2.9.1 SST Sensing Ltd. Company Profile
2.9.2 SST Sensing Ltd. Optical Liquid Level Sensors Product Specification
2.9.3 SST Sensing Ltd. Optical Liquid Level Sensors Production Capacity, Revenue, Price and Gross Margin (2018-2021)
2.10 Automation Products Group, Inc.
2.10.1 Automation Products Group, Inc. Company Profile
2.10.2 Automation Products Group, Inc. Optical Liquid Level Sensors Product Specification
2.10.3 Automation Products Group, Inc. Optical Liquid Level Sensors Production Capacity, Revenue, Price and Gross Margin (2018-2021)
3 Sales, Revenue and Market Share by Manufacturer
3.1 Global Optical Liquid Level Sensors Sales and Market Share by Manufacturer (2018-2021)
3.2 Global Optical Liquid Level Sensors Revenue and Market Share by Manufacturer (2018-2021)
3.3 Market Competition Trend
4 Sales by Region
4.1 Global Optical Liquid Level Sensors Sales Volume Market Share by Region (2018-2021)
4.2 Global Optical Liquid Level Sensors Sales Revenue Market Share by Region (2018-2021)
4.3 North America Optical Liquid Level Sensors Sales Volume
4.3.1 North America Optical Liquid Level Sensors Sales Volume Growth Rate (2018-2021)
4.3.2 North America Optical Liquid Level Sensors Sales Volume Capacity, Revenue, Price and Gross Margin (2018-2021)
4.4 East Asia Optical Liquid Level Sensors Sales Volume
4.4.1 East Asia Optical Liquid Level Sensors Sales Volume Growth Rate (2018-2021)
4.4.2 East Asia Optical Liquid Level Sensors Sales Volume Capacity, Revenue, Price and Gross Margin (2018-2021)
4.5 Europe Optical Liquid Level Sensors Sales Volume (2018-2021)
4.5.1 Europe Optical Liquid Level Sensors Sales Volume Growth Rate (2018-2021)
4.5.2 Europe Optical Liquid Level Sensors Sales Volume Capacity, Revenue, Price and Gross Margin (2018-2021)
4.6 South Asia Optical Liquid Level Sensors Sales Volume (2018-2021)
4.6.1 South Asia Optical Liquid Level Sensors Sales Volume Growth Rate (2018-2021)
4.6.2 South Asia Optical Liquid Level Sensors Sales Volume Capacity, Revenue, Price and Gross Margin (2018-2021)
4.7 Southeast Asia Optical Liquid Level Sensors Sales Volume (2018-2021)
4.7.1 Southeast Asia Optical Liquid Level Sensors Sales Volume Growth Rate (2018-2021)
4.7.2 Southeast Asia Optical Liquid Level Sensors Sales Volume Capacity, Revenue, Price and Gross Margin (2018-2021)
4.8 Middle East Optical Liquid Level Sensors Sales Volume (2018-2021)
4.8.1 Middle East Optical Liquid Level Sensors Sales Volume Growth Rate (2018-2021)
4.8.2 Middle East Optical Liquid Level Sensors Sales Volume Capacity, Revenue, Price and Gross Margin (2018-2021)
4.9 Africa Optical Liquid Level Sensors Sales Volume (2018-2021)
4.9.1 Africa Optical Liquid Level Sensors Sales Volume Growth Rate (2018-2021)
4.9.2 Africa Optical Liquid Level Sensors Sales Volume Capacity, Revenue, Price and Gross Margin (2018-2021)
4.10 Oceania Optical Liquid Level Sensors Sales Volume (2018-2021)
4.10.1 Oceania Optical Liquid Level Sensors Sales Volume Growth Rate (2018-2021)
4.10.2 Oceania Optical Liquid Level Sensors Sales Volume Capacity, Revenue, Price and Gross Margin (2018-2021)
4.11 South America Optical Liquid Level Sensors Sales Volume (2018-2021)
4.11.1 South America Optical Liquid Level Sensors Sales Volume Growth Rate (2018-2021)
4.11.2 South America Optical Liquid Level Sensors Sales Volume Capacity, Revenue, Price and Gross Margin (2018-2021)
4.12 Rest of the World Optical Liquid Level Sensors Sales Volume (2018-2021)
4.12.1 Rest of the World Optical Liquid Level Sensors Sales Volume Growth Rate (2018-2021)
4.12.2 Rest of the World Optical Liquid Level Sensors Sales Volume Capacity, Revenue, Price and Gross Margin (2018-2021)
5 North America
5.1 North America Optical Liquid Level Sensors Consumption by Countries
5.2 United States
5.3 Canada
5.4 Mexico
6 East Asia
6.1 East Asia Optical Liquid Level Sensors Consumption by Countries
6.2 China
6.3 Japan
6.4 South Korea
7 Europe
7.1 Europe Optical Liquid Level Sensors Consumption by Countries
7.2 Germany
7.3 United Kingdom
7.4 France
7.5 Italy
7.6 Russia
7.7 Spain
7.8 Netherlands
7.9 Switzerland
7.10 Poland
8 South Asia
8.1 South Asia Optical Liquid Level Sensors Consumption by Countries
8.2 India
8.3 Pakistan
8.4 Bangladesh
9 Southeast Asia
9.1 Southeast Asia Optical Liquid Level Sensors Consumption by Countries
9.2 Indonesia
9.3 Thailand
9.4 Singapore
9.5 Malaysia
9.6 Philippines
9.7 Vietnam
9.8 Myanmar
10 Middle East
10.1 Middle East Optical Liquid Level Sensors Consumption by Countries
10.2 Turkey
10.3 Saudi Arabia
10.4 Iran
10.5 United Arab Emirates
10.6 Israel
10.7 Iraq
10.8 Qatar
10.9 Kuwait
10.10 Oman
11 Africa
11.1 Africa Optical Liquid Level Sensors Consumption by Countries
11.2 Nigeria
11.3 South Africa
11.4 Egypt
11.5 Algeria
11.6 Morocco
12 Oceania
12.1 Oceania Optical Liquid Level Sensors Consumption by Countries
12.2 Australia
12.3 New Zealand
13 South America
13.1 South America Optical Liquid Level Sensors Consumption by Countries
13.2 Brazil
13.3 Argentina
13.4 Columbia
13.5 Chile
13.6 Venezuela
13.7 Peru
13.8 Puerto Rico
13.9 Ecuador
14 Rest of the World
14.1 Rest of the World Optical Liquid Level Sensors Consumption by Countries
14.2 Kazakhstan
15 Sales Volume, Sales Revenue, Sales Price Trend by Type
15.1 Global Optical Liquid Level Sensors Sales Volume Market Share by Type (2018-2021)
15.2 Global Optical Liquid Level Sensors Sales Revenue Market Share by Type (2018-2021)
15.3 Global Optical Liquid Level Sensors Sales Price by Type (2018-2021)
16 Consumption Analysis by Application
16.1 Global Optical Liquid Level Sensors Consumption Volume by Application (2018-2021)
16.2 Global Optical Liquid Level Sensors Consumption Value by Application (2018-2021)
17 Production and Supply Forecast
17.1 Global Forecasted Production of Optical Liquid Level Sensors (2022-2029)
17.2 Global Forecasted Revenue of Optical Liquid Level Sensors (2022-2029)
17.3 Global Forecasted Price of Optical Liquid Level Sensors (2018-2029)
17.4 Global Forecasted Production of Optical Liquid Level Sensors by Region (2022-2029)
17.4.1 North America Optical Liquid Level Sensors Production, Revenue Forecast (2022-2029)
17.4.2 East Asia Optical Liquid Level Sensors Production, Revenue Forecast (2022-2029)
17.4.3 Europe Optical Liquid Level Sensors Production, Revenue Forecast (2022-2029)
17.4.4 South Asia Optical Liquid Level Sensors Production, Revenue Forecast (2022-2029)
17.4.5 Southeast Asia Optical Liquid Level Sensors Production, Revenue Forecast (2022-2029)
17.4.6 Middle East Optical Liquid Level Sensors Production, Revenue Forecast (2022-2029)
17.4.7 Africa Optical Liquid Level Sensors Production, Revenue Forecast (2022-2029)
17.4.8 Oceania Optical Liquid Level Sensors Production, Revenue Forecast (2022-2029)
17.4.9 South America Optical Liquid Level Sensors Production, Revenue Forecast (2022-2029)
17.4.10 Rest of the World Optical Liquid Level Sensors Production, Revenue Forecast (2022-2029)
17.5 Forecast by Type and by Application (2022-2029)
17.5.1 Global Sales Volume, Sales Revenue and Sales Price Forecast by Type (2022-2029)
17.5.2 Global Forecasted Consumption of Optical Liquid Level Sensors by Application (2022-2029)
18 Sales Channel, Distributors, Traders and Dealers
18.1 Sales Channel
18.1.1 Direct Channel
18.1.2 Indirect Channel
18.2 Distributors, Traders and Dealers
19 Research Findings and Conclusion
20 Appendix
20.1 Methodology
20.2 Data Source
20.3 Disclaimer
20.4 About US
Frequently Asked Questions About This Report
Choose License Type
Each market study on Reports Globe will be revised based on COVID-19 impact analysis
How can we help you?
Our salient features
Best Solution
We will help you understand value propositions of various reports across numerous domains and suggest the best possible solution to suffice your research needs.
Customized Research
Our team of analysts and consultants provide assistance for customized research requirements
Max ROI
Guaranteed maximum assistance to help you get your reports at the optimum prices, thereby ensuring maximum returns on investment.
24/7 Support
24X7 availability to help you through the buying process as well as answer any of your doubts.