North America Virtual Cards Market Size, Share, Growth, Trends, Statistics Analysis Report and By Segment Forecasts 2024 to 2033

Market Overview

The North America virtual cards market is a rapidly growing segment within the broader digital payment landscape. Virtual cards, also known as temporary or disposable cards, are digital payment instruments that provide a secure and convenient way to make online transactions without exposing the user’s primary payment credentials. These cards generate a unique, randomly generated card number, expiration date, and security code for each transaction, offering an additional layer of protection against fraud and unauthorized access to financial information.

Virtual cards have gained widespread adoption across various industries, including corporate payments, e-commerce, travel, and subscription-based services. They offer numerous benefits, such as enhanced security, improved expense tracking, and streamlined reconciliation processes. In the corporate sector, virtual cards enable businesses to maintain tight control over employee spending, set spending limits, and reduce the risk of misuse or fraud. For consumers, virtual cards provide a convenient and secure way to make online purchases without the need to share sensitive payment information with multiple merchants.
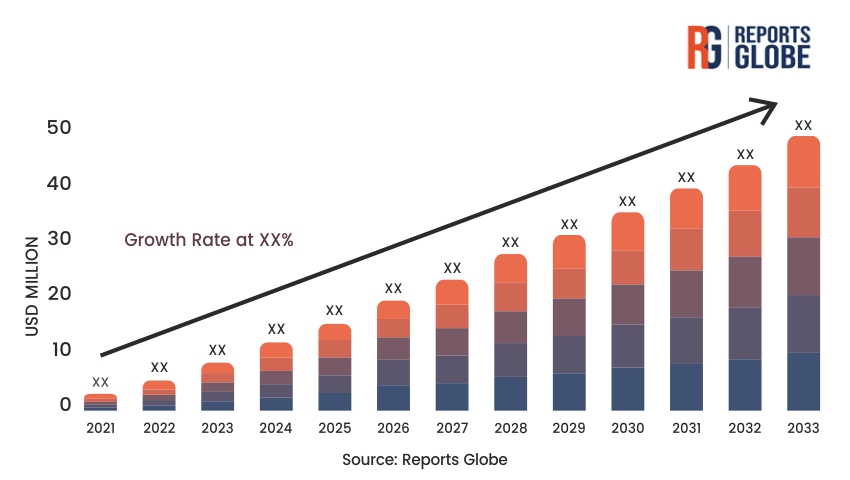
Key Takeaways of the Market

  • The North America virtual cards market is experiencing significant growth driven by the increasing demand for secure and convenient online payment solutions.
  • Virtual cards offer enhanced security features, reducing the risk of fraud and unauthorized access to financial information in online transactions.
  • Corporate adoption of virtual cards is driven by the need for improved expense management, spending control, and streamlined reconciliation processes.
  • The e-commerce and subscription-based service industries are major drivers of virtual card adoption, as they enable secure recurring payments.
  • The market is witnessing a surge in competition, with traditional financial institutions and fintech companies vying for market share by offering innovative virtual card solutions.

Market Driver

The primary driver of the North America virtual cards market is the increasing demand for secure and convenient online payment solutions. As the e-commerce industry continues to grow and online transactions become more prevalent, the need for robust security measures to protect sensitive financial information has become paramount. Virtual cards address this need by generating unique, disposable card numbers for each transaction, mitigating the risk of payment data being compromised in the event of a data breach or fraud.

Furthermore, the adoption of virtual cards in the corporate sector is being driven by the need for improved expense management, spending control, and streamlined reconciliation processes. Virtual cards enable businesses to set specific spending limits, track employee expenses in real-time, and reconcile payments more efficiently. This not only enhances financial control but also reduces the risk of misuse or fraud associated with traditional corporate credit cards.

Additionally, the growth of subscription-based services and recurring payment models has fueled the demand for virtual cards. These cards offer a secure and convenient way to facilitate recurring payments without exposing sensitive payment information to multiple merchants, minimizing the risk of data breaches and unauthorized charges.

Market Restraint

One of the significant restraints for the North America virtual cards market is the limited acceptance and awareness among merchants and service providers. While virtual cards are gaining traction, there are still instances where merchants may be unfamiliar with the concept or hesitant to accept these payment instruments due to a lack of understanding or concerns about processing fees.

Another potential restraint is the perception of complexity and integration challenges associated with implementing virtual card solutions. Some businesses, particularly smaller organizations, may view the adoption of virtual cards as a complex process requiring significant technical expertise and integration efforts with existing payment systems and accounting software.

Additionally, concerns around data security and the risk of fraud or unauthorized access to virtual card information could pose a restraint for some users. While virtual cards offer enhanced security features, there may still be perceptions of vulnerability or concerns about the potential for misuse or mishandling of virtual card data.

Market Opportunity

The North America virtual cards market presents several opportunities for growth and innovation. As businesses and consumers become increasingly aware of the benefits of virtual cards, there is a significant opportunity for financial institutions and fintech companies to develop innovative virtual card solutions tailored to specific industries or use cases.

For instance, the growing trend of remote work and the gig economy presents an opportunity to offer virtual card solutions specifically designed for freelancers, contractors, and remote employees. These solutions could provide features such as easy expense tracking, seamless integration with accounting software, and customizable spending limits, catering to the unique needs of this user segment.

Additionally, the rise of buy-now-pay-later (BNPL) services and alternative lending platforms creates opportunities for virtual cards to be integrated into these platforms, enabling secure and convenient payment processing while minimizing the risk of fraud and data breaches.

Furthermore, the integration of virtual cards with emerging technologies, such as biometrics, tokenization, and mobile wallets, could enhance the user experience and drive further adoption. By offering advanced security features and seamless digital payment capabilities, virtual card providers can differentiate their offerings and appeal to tech-savvy and security-conscious users.

Market Segment Analysis

  1. By User Type:
    • Consumer Segment: The consumer segment encompasses individual users who leverage virtual cards for online purchases, subscription services, and secure one-time transactions. Virtual card providers in this segment often emphasize features such as ease of use, mobile app integration, and fraud protection to appeal to tech-savvy and security-conscious consumers.
    • Corporate Segment: The corporate segment includes businesses of all sizes that use virtual cards for expense management, employee spending control, and streamlined reconciliation processes. Virtual card solutions for this segment typically offer features like centralized fund management, customizable spending limits, real-time expense tracking, and seamless integration with accounting software.
  2. By Industry Vertical:
    • E-commerce: The e-commerce industry is a significant driver of virtual card adoption, as online merchants seek secure payment solutions to protect against fraud and data breaches. Virtual cards enable one-time or recurring payments without exposing sensitive financial information to multiple merchants.
    • Travel and Hospitality: The travel and hospitality industry has embraced virtual cards as a way to streamline payments for travel expenses, accommodation bookings, and other related services. Virtual cards offer enhanced security, expense tracking, and simplified reconciliation processes for businesses and individual travelers.

Regional Analysis

Within the North America region, the United States dominates the virtual cards market, driven by the country’s large consumer base, thriving e-commerce industry, and the presence of major financial institutions and fintech companies. The United States has witnessed a significant adoption of virtual cards across various sectors, including retail, travel, and corporate payments.

In Canada, the virtual cards market is also experiencing steady growth, fueled by the increasing demand for secure online payment solutions and the proliferation of e-commerce platforms. Major Canadian banks and fintech companies have recognized the potential of virtual cards and have introduced innovative offerings to cater to both consumer and corporate needs.

However, the adoption rate and market penetration of virtual cards may vary across different regions within North America, influenced by factors such as consumer awareness, regulatory environments, and the adoption of digital payment technologies among businesses and individuals.

Competitive Analysis

The North America virtual cards market is highly competitive, with both traditional financial institutions and fintech companies vying for market share. Major players in the market include banks like Citibank, JPMorgan Chase, and Bank of America, as well as fintech companies like Airbase, Ramp, and Divvy.

Competition in the market is driven by factors such as product features, ease of use, integration capabilities, security measures, and pricing models. Traditional banks often leverage their established brand recognition, extensive customer base, and existing payment infrastructure to offer virtual card solutions as part of their broader financial services portfolio.

However, fintech companies have disrupted the market by offering innovative and user-friendly virtual card solutions tailored to specific use cases or industries. These companies often focus on streamlined onboarding processes, intuitive user interfaces, and seamless integration with other financial tools and accounting software.

Furthermore, partnerships and collaborations between virtual card providers and industry-specific platforms or service providers have become increasingly important in gaining a competitive edge. These collaborations enable providers to expand their reach, offer integrated solutions, and cater to the specific needs of different user segments.

As the market continues to evolve, competition is expected to intensify, with players focusing on enhancing their security features, introducing advanced analytics and expense management capabilities, and offering personalized experiences to differentiate themselves and capture a larger share of the growing virtual cards market.

Key Industry Developments

  • Introduction of innovative virtual card products and services tailored to specific industries or use cases, such as e-commerce, travel, and corporate expense management.
  • Integration of virtual cards with mobile wallets, digital banking platforms, and accounting software for seamless user experiences and streamlined expense tracking.
  • Partnerships and collaborations between virtual card providers, industry-specific platforms, and service providers to expand distribution channels and offer integrated solutions.
  • Emphasis on data security and fraud prevention measures, including the adoption of biometric authentication, tokenization, and advanced encryption technologies.
  • Expansion of virtual card offerings to cater to the needs of freelancers, gig workers, and remote employees in the evolving digital economy.
  • Regulatory developments and compliance initiatives to ensure consumer protection, data privacy, and responsible lending practices in the virtual cards market.

Future Outlook

The future outlook for the North America virtual cards market is highly promising, driven by the increasing demand for secure and convenient online payment solutions across various industries and user segments. As e-commerce and digital transactions continue to grow, the need for robust security measures and fraud prevention will drive the adoption of virtual cards.

Technological advancements and the proliferation of mobile payment technologies will play a crucial role in shaping the future of the virtual cards market. Providers will focus on enhancing their digital capabilities, offering seamless integration with mobile wallets, and providing advanced security features such as biometrics and tokenization to cater to the evolving needs of tech-savvy users.

Moreover, the rise of the gig economy and remote work trends will create new opportunities for virtual card providers. As more individuals embrace flexible work arrangements and freelancing, the demand for virtual card solutions tailored to their unique needs, such as expense tracking and seamless integration with accounting software, will increase.

Partnerships and collaborations between virtual card providers, industry-specific platforms, and service providers will continue to be a key strategy for expanding market reach and offering integrated solutions. These collaborations will enable providers to tap into new customer segments, leverage existing distribution channels, and offer bundled or co-branded solutions tailored to specific industries or use cases.

Additionally, the focus on data security, fraud prevention, and regulatory compliance will remain a priority for virtual card providers. Adopting cutting-edge security technologies, implementing robust data protection measures, and adhering to industry regulations will be essential to building trust and confidence among consumers and businesses, ensuring the long-term growth and success of the virtual cards market.

Overall, the North America virtual cards market is poised for significant growth, driven by the increasing demand for secure online payment solutions, the rise of digital transactions, and the continuous evolution of consumer preferences and technology.

Market Segmentation

  • By User Type:
    • Consumers
    • Businesses
      • Small and Medium Enterprises (SMEs)
      • Large Enterprises
  • By Industry Vertical:
    • E-commerce
    • Travel and Hospitality
    • Retail
    • Entertainment and Media
    • Healthcare
    • Others (Utilities, Education, etc.)
  • By Payment Type:
    • One-time Payments
    • Recurring Payments
  • By Distribution Channel:
    • Banks and Financial Institutions
    • Fintech Companies
    • Online Platforms
  • By Country:
    • United States
    • Canada

Table of Contents

Chapter 1. Research Methodology & Data Sources

1.1. Data Analysis Models
1.2. Research Scope & Assumptions
1.3. List of Primary & Secondary Data Sources 

Chapter 2. Executive Summary

2.1. Market Overview
2.2. Segment Overview
2.3. Market Size and Estimates, 2021 to 2033
2.4. Market Size and Estimates, By Segments, 2021 to 2033

Chapter 3. Industry Analysis

3.1. Market Segmentation
3.2. Market Definitions and Assumptions
3.3. Supply chain analysis
3.4. Porter’s five forces analysis
3.5. PEST analysis
3.6. Market Dynamics
3.6.1. Market Driver Analysis
3.6.2. Market Restraint analysis
3.6.3. Market Opportunity Analysis
3.7. Competitive Positioning Analysis, 2023
3.8. Key Player Ranking, 2023

Chapter 4. Market Segment Analysis- Segment 1

4.1.1. Historic Market Data & Future Forecasts, 2024-2033
4.1.2. Historic Market Data & Future Forecasts by Region, 2024-2033

Chapter 5. Market Segment Analysis- Segment 2

5.1.1. Historic Market Data & Future Forecasts, 2024-2033
5.1.2. Historic Market Data & Future Forecasts by Region, 2024-2033

Chapter 6. Regional or Country Market Insights

** Reports focusing on a particular region or country will contain data unique to that region or country **

6.1. Global Market Data & Future Forecasts, By Region 2024-2033

6.2. North America
6.2.1. Historic Market Data & Future Forecasts, 2024-2033
6.2.2. Historic Market Data & Future Forecasts, By Segment 1, 2024-2033
6.2.3. Historic Market Data & Future Forecasts, By Segment 2, 2024-2033

6.2.4. U.S.
6.2.4.1. Historic Market Data & Future Forecasts, 2024-2033
6.2.4.2. Historic Market Data & Future Forecasts, By Segment 1, 2024-2033
6.2.4.3. Historic Market Data & Future Forecasts, By Segment 2, 2024-2033

6.2.5. Canada
6.2.5.1. Historic Market Data & Future Forecasts, 2024-2033
6.2.5.2. Historic Market Data & Future Forecasts, By Segment 1, 2024-2033
6.2.5.3. Historic Market Data & Future Forecasts, By Segment 2, 2024-2033

6.3. Europe
6.3.1. Historic Market Data & Future Forecasts, 2024-2033
6.3.2. Historic Market Data & Future Forecasts, By Segment 1, 2024-2033
6.3.3. Historic Market Data & Future Forecasts, By Segment 2, 2024-2033

6.3.4. UK
6.3.4.1. Historic Market Data & Future Forecasts, 2024-2033
6.3.4.2. Historic Market Data & Future Forecasts, By Segment 1, 2024-2033
6.3.4.3. Historic Market Data & Future Forecasts, By Segment 2, 2024-2033

6.3.5. Germany
6.3.5.1. Historic Market Data & Future Forecasts, 2024-2033
6.3.5.2. Historic Market Data & Future Forecasts, By Segment 1, 2024-2033
6.3.5.3. Historic Market Data & Future Forecasts, By Segment 2, 2024-2033

6.3.6. France
6.3.6.1. Historic Market Data & Future Forecasts, 2024-2033
6.3.6.2. Historic Market Data & Future Forecasts, By Segment 1, 2024-2033
6.3.6.3. Historic Market Data & Future Forecasts, By Segment 2, 2024-2033

6.4. Asia Pacific
6.4.1. Historic Market Data & Future Forecasts, 2024-2033
6.4.2. Historic Market Data & Future Forecasts, By Segment 1, 2024-2033
6.4.3. Historic Market Data & Future Forecasts, By Segment 2, 2024-2033

6.4.4. China
6.4.4.1. Historic Market Data & Future Forecasts, 2024-2033
6.4.4.2. Historic Market Data & Future Forecasts, By Segment 1, 2024-2033
6.4.4.3. Historic Market Data & Future Forecasts, By Segment 2, 2024-2033

6.4.5. India
6.4.5.1. Historic Market Data & Future Forecasts, 2024-2033
6.4.5.2. Historic Market Data & Future Forecasts, By Segment 1, 2024-2033
6.4.5.3. Historic Market Data & Future Forecasts, By Segment 2, 2024-2033

6.4.6. Japan
6.4.6.1. Historic Market Data & Future Forecasts, 2024-2033
6.4.6.2. Historic Market Data & Future Forecasts, By Segment 1, 2024-2033
6.4.6.3. Historic Market Data & Future Forecasts, By Segment 2, 2024-2033

6.4.7. South Korea
6.4.7.1. Historic Market Data & Future Forecasts, 2024-2033
6.4.7.2. Historic Market Data & Future Forecasts, By Segment 1, 2024-2033
6.4.7.3. Historic Market Data & Future Forecasts, By Segment 2, 2024-2033

6.5. Latin America
6.5.1. Historic Market Data & Future Forecasts, 2024-2033
6.5.2. Historic Market Data & Future Forecasts, By Segment 1, 2024-2033
6.5.3. Historic Market Data & Future Forecasts, By Segment 2, 2024-2033

6.5.4. Brazil
6.5.4.1. Historic Market Data & Future Forecasts, 2024-2033
6.5.4.2. Historic Market Data & Future Forecasts, By Segment 1, 2024-2033
6.5.4.3. Historic Market Data & Future Forecasts, By Segment 2, 2024-2033

6.5.5. Mexico
6.5.5.1. Historic Market Data & Future Forecasts, 2024-2033
6.5.5.2. Historic Market Data & Future Forecasts, By Segment 1, 2024-2033
6.5.5.3. Historic Market Data & Future Forecasts, By Segment 2, 2024-2033

6.6. Middle East & Africa
6.6.1. Historic Market Data & Future Forecasts, 2024-2033
6.6.2. Historic Market Data & Future Forecasts, By Segment 1, 2024-2033
6.6.3. Historic Market Data & Future Forecasts, By Segment 2, 2024-2033

6.6.4. UAE
6.6.4.1. Historic Market Data & Future Forecasts, 2024-2033
6.6.4.2. Historic Market Data & Future Forecasts, By Segment 1, 2024-2033
6.6.4.3. Historic Market Data & Future Forecasts, By Segment 2, 2024-2033

6.6.5. Saudi Arabia
6.6.5.1. Historic Market Data & Future Forecasts, 2024-2033
6.6.5.2. Historic Market Data & Future Forecasts, By Segment 1, 2024-2033
6.6.5.3. Historic Market Data & Future Forecasts, By Segment 2, 2024-2033

6.6.6. South Africa
6.6.6.1. Historic Market Data & Future Forecasts, 2024-2033
6.6.6.2. Historic Market Data & Future Forecasts, By Segment 1, 2024-2033
6.6.6.3. Historic Market Data & Future Forecasts, By Segment 2, 2024-2033

Chapter 7. Competitive Landscape

7.1. Competitive Heatmap Analysis, 2023
7.2. Competitive Product Analysis

7.3. Company 1
7.3.1. Company Description
7.3.2. Financial Highlights
7.3.3. Product Portfolio
7.3.4. Strategic Initiatives

7.4. Company 2
7.4.1. Company Description
7.4.2. Financial Highlights
7.4.3. Product Portfolio
7.4.4. Strategic Initiatives

7.5. Company 3
7.5.1. Company Description
7.5.2. Financial Highlights
7.5.3. Product Portfolio
7.5.4. Strategic Initiatives

7.6. Company 4
7.6.1. Company Description
7.6.2. Financial Highlights
7.6.3. Product Portfolio
7.6.4. Strategic Initiatives

7.7. Company 5
7.7.1. Company Description
7.7.2. Financial Highlights
7.7.3. Product Portfolio
7.7.4. Strategic Initiatives

7.8. Company 6
7.8.1. Company Description
7.8.2. Financial Highlights
7.8.3. Product Portfolio
7.8.4. Strategic Initiatives

7.9. Company 7
7.9.1. Company Description
7.9.2. Financial Highlights
7.9.3. Product Portfolio
7.9.4. Strategic Initiatives

7.10. Company 8
7.10.1. Company Description
7.10.2. Financial Highlights
7.10.3. Product Portfolio
7.10.4. Strategic Initiatives

7.11. Company 9
7.11.1. Company Description
7.11.2. Financial Highlights
7.11.3. Product Portfolio
7.11.4. Strategic Initiatives

7.12. Company 10
7.12.1. Company Description
7.12.2. Financial Highlights
7.12.3. Product Portfolio
7.12.4. Strategic Initiatives

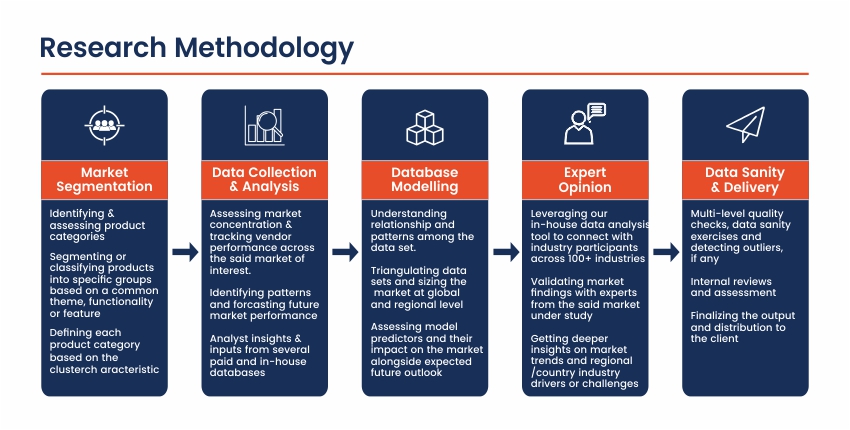
Research Methodology

Frequently Asked Questions About This Report

Choose License Type

$2,430
$2,970
$3,510

Our salient features

Best Solution

We will assist you in comprehending the value propositions of various reports across multiple domains and recommend the optimal solution to meet your research requirements.

Customized Research

Our team of analysts and consultants provide assistance for customized research requirements

Max ROI

Guaranteed maximum assistance to help you get your reports at the optimum prices, thereby ensuring maximum returns on investment.

24/7 Support

24X7 availability to help you through the buying process as well as answer any of your doubts.

Get a free sample report

This free sample study provides a comprehensive overview of the report, including an executive summary, market segments, complete analysis, country-level analysis, and more.

Our Clients

We've Received Your Request

We Thank You for filling out your requirements. Our sales team will get in touch with you shortly.