North America Family Indoor Entertainment Centers Market Size, Share, Growth, Trends, Statistics Analysis Report and By Segment Forecasts 2024 to 2033

Market Overview

The North America Family Indoor Entertainment Centers (FEC) Market has experienced significant growth in recent years, driven by increasing disposable incomes, changing consumer preferences, and a growing emphasis on family-oriented leisure activities. FECs offer a wide range of entertainment options, including arcade games, virtual reality experiences, sports activities, and dining facilities, catering to families seeking engaging and interactive experiences. The market has witnessed the entry of several new players, as well as the expansion of existing ones, leading to increased competition and innovation in the industry. The COVID-19 pandemic had a significant impact on the market, with temporary closures and reduced capacities affecting revenue streams. However, as restrictions ease and consumer confidence improves, the market is expected to rebound and continue its growth trajectory in the coming years.
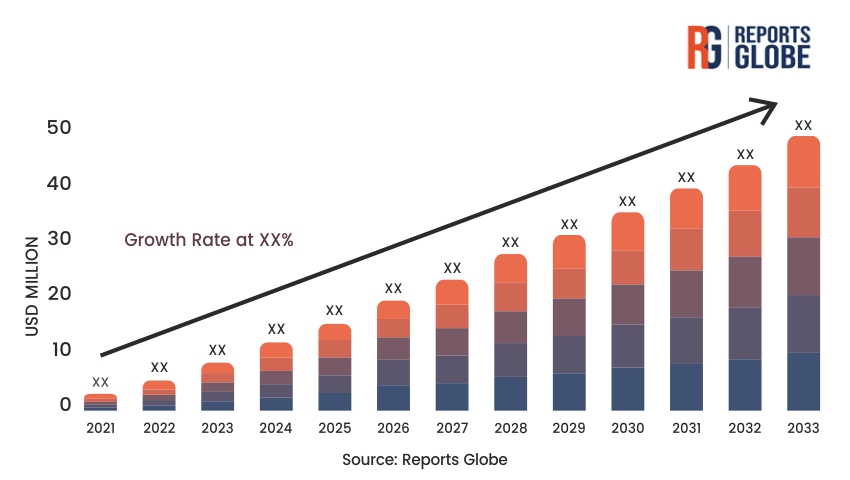
Key Takeaways of the Market

  • The North America FEC market is projected to grow at a CAGR of 8.5% during the forecast period (2021-2028).
  • The increasing popularity of immersive and interactive entertainment experiences is driving market growth.
  • The integration of advanced technologies, such as virtual reality and augmented reality, is attracting a wider customer base.
  • The COVID-19 pandemic has accelerated the adoption of contactless payment solutions and hygiene measures in FECs.
  • Partnerships and collaborations between FEC operators and popular entertainment brands are creating new growth opportunities.

Market Driver

One of the key drivers of the North America FEC market is the increasing demand for immersive and interactive entertainment experiences. Consumers, particularly millennials and Generation Z, are seeking engaging and memorable experiences that go beyond traditional entertainment options. FECs that offer a blend of physical activities, gaming, and technology-driven experiences are well-positioned to capitalize on this trend. Additionally, the rise in disposable incomes and the growing importance of family bonding and leisure activities are contributing to the market’s growth. Families are increasingly seeking out entertainment options that cater to multiple age groups and provide a fun and engaging environment for all.

Market Restraint

Despite the positive growth prospects, the North America FEC market faces certain restraints. One of the primary challenges is the high initial investment required to set up and operate an FEC. The cost of real estate, gaming equipment, and attractions can be substantial, making it difficult for new entrants to establish a foothold in the market. Moreover, the ongoing maintenance and upgrading of facilities to keep up with changing consumer preferences and technological advancements can strain profit margins. The seasonal nature of the business, with peak demand during holidays and weekends, can also pose operational challenges and affect revenue stability.

Market Opportunity

The North America FEC market presents several opportunities for growth and innovation. One such opportunity lies in the integration of advanced technologies, such as virtual reality (VR) and augmented reality (AR), into the entertainment offerings. These technologies provide immersive experiences that transport users to different worlds and enhance the overall entertainment value. FECs that successfully incorporate VR and AR attractions can differentiate themselves from competitors and attract tech-savvy consumers. Additionally, the growing trend of edutainment, which combines education and entertainment, opens up avenues for FECs to partner with educational institutions and offer learning-based activities and workshops.

Market Segment Analysis

  1. Arcade Games Segment: The arcade games segment holds a significant market share in the North America FEC market. Classic arcade games, such as air hockey, skee-ball, and racing simulators, remain popular among visitors of all ages. The segment has also witnessed the integration of modern gaming technologies, such as motion sensors and interactive displays, to enhance the gaming experience. FEC operators are constantly updating their arcade game offerings to keep up with the latest trends and maintain customer engagement. The revenue generated from arcade games contributes significantly to the overall profitability of FECs.
  2. Virtual Reality (VR) Segment: The virtual reality segment is experiencing rapid growth within the North America FEC market. VR technology offers immersive experiences that transport users to different virtual environments, creating a sense of presence and engagement. FECs are incorporating VR attractions, such as VR escape rooms, VR motion simulators, and VR gaming arenas, to attract tech-savvy consumers and differentiate themselves from traditional entertainment centers. The VR segment is expected to witness significant growth in the coming years, driven by advancements in VR hardware and software, as well as increasing consumer demand for immersive experiences.

Regional Analysis

The North America FEC market can be segmented into the United States and Canada. The United States holds the largest market share, owing to its large population, diverse demographics, and well-established entertainment industry. The country has a strong presence of major FEC chains, such as Dave & Buster’s, Main Event Entertainment, and Chuck E. Cheese’s, which have expanded their footprint across multiple states. The US market is characterized by intense competition, with operators focusing on offering unique experiences and attractions to attract customers.

Canada also presents significant growth opportunities for the FEC market. The country has a growing middle class with increasing disposable incomes, leading to higher spending on leisure and entertainment activities. Canadian FECs are adopting innovative concepts and themes to differentiate themselves from competitors and cater to local preferences. The market is witnessing the entry of international FEC brands, as well as the expansion of domestic players, contributing to the overall growth of the industry.

Competitive Analysis

The North America FEC market is highly competitive, with the presence of several established players and new entrants vying for market share. Major companies in the market include Dave & Buster’s, Main Event Entertainment, Chuck E. Cheese’s, and Cinergy Entertainment Group. These companies have a strong brand presence, extensive geographic reach, and a diverse range of entertainment offerings.

To stay competitive, FEC operators are focusing on providing unique and immersive experiences that differentiate them from competitors. They are investing in advanced technologies, such as virtual reality and interactive gaming, to attract tech-savvy consumers. Additionally, FECs are expanding their food and beverage offerings to enhance the overall customer experience and increase revenue streams.

Smaller and regional players are also making their mark in the market by offering niche experiences and targeting specific customer segments. They are leveraging local partnerships and community engagement to build brand loyalty and attract customers.

Key Industry Developments

  • In 2021, Dave & Buster’s launched a new virtual reality attraction, “Terminator: Guardian of Fate,” in partnership with VRstudios and Reelplay.
  • In 2022, Main Event Entertainment announced plans to open 10 new centers across the United States, expanding its geographic footprint.
  • In 2023, Chuck E. Cheese’s introduced a new interactive dance experience, “Dance Party,” incorporating motion-sensing technology and interactive lighting.
  • In 2024, Cinergy Entertainment Group partnered with a leading edutainment provider to offer STEM-based workshops and activities at its centers.

Future Outlook

The North America FEC market is expected to witness significant growth in the coming years, driven by increasing consumer demand for immersive and interactive entertainment experiences. The integration of advanced technologies, such as virtual reality and augmented reality, will play a crucial role in shaping the future of the market. FECs that successfully incorporate these technologies and offer unique experiences will be well-positioned to capture market share and drive growth.

The market is also likely to see increased consolidation, with larger players acquiring smaller operators to expand their geographic reach and diversify their entertainment offerings. Partnerships and collaborations between FECs and popular entertainment brands, such as movie franchises and gaming companies, will create new growth opportunities and attract a wider customer base.

As consumer preferences continue to evolve, FECs will need to adapt and innovate to stay relevant. The focus on providing immersive experiences, personalized offerings, and seamless customer journeys will be key to success in the highly competitive market.

Market Segmentation

The North America Family Indoor Entertainment Centers Market can be segmented based on various factors, including:

  • Type of Facility:
    • Arcade Studios
    • VR Gaming Zones
    • Indoor Sports Facilities
    • Edutainment Centers
    • Others
  • Visitor Demographics:
    • Families with Children
    • Teenagers and Young Adults
    • Corporate Groups
    • Birthday Parties and Special Events
  • Revenue Source:
    • Gaming and Attractions
    • Food and Beverages
    • Merchandising
    • Ticket Sales
    • Advertising and Sponsorships
  • Geography:
    • United States
    • Canada
  • Technology Integration:
    • Virtual Reality (VR)
    • Augmented Reality (AR)
    • Motion Tracking and Gesture Recognition
    • Contactless Payment Solutions
    • Others

Table of Contents

Chapter 1. Research Methodology & Data Sources

1.1. Data Analysis Models
1.2. Research Scope & Assumptions
1.3. List of Primary & Secondary Data Sources 

Chapter 2. Executive Summary

2.1. Market Overview
2.2. Segment Overview
2.3. Market Size and Estimates, 2021 to 2033
2.4. Market Size and Estimates, By Segments, 2021 to 2033

Chapter 3. Industry Analysis

3.1. Market Segmentation
3.2. Market Definitions and Assumptions
3.3. Supply chain analysis
3.4. Porter’s five forces analysis
3.5. PEST analysis
3.6. Market Dynamics
3.6.1. Market Driver Analysis
3.6.2. Market Restraint analysis
3.6.3. Market Opportunity Analysis
3.7. Competitive Positioning Analysis, 2023
3.8. Key Player Ranking, 2023

Chapter 4. Market Segment Analysis- Segment 1

4.1.1. Historic Market Data & Future Forecasts, 2024-2033
4.1.2. Historic Market Data & Future Forecasts by Region, 2024-2033

Chapter 5. Market Segment Analysis- Segment 2

5.1.1. Historic Market Data & Future Forecasts, 2024-2033
5.1.2. Historic Market Data & Future Forecasts by Region, 2024-2033

Chapter 6. Regional or Country Market Insights

** Reports focusing on a particular region or country will contain data unique to that region or country **

6.1. Global Market Data & Future Forecasts, By Region 2024-2033

6.2. North America
6.2.1. Historic Market Data & Future Forecasts, 2024-2033
6.2.2. Historic Market Data & Future Forecasts, By Segment 1, 2024-2033
6.2.3. Historic Market Data & Future Forecasts, By Segment 2, 2024-2033

6.2.4. U.S.
6.2.4.1. Historic Market Data & Future Forecasts, 2024-2033
6.2.4.2. Historic Market Data & Future Forecasts, By Segment 1, 2024-2033
6.2.4.3. Historic Market Data & Future Forecasts, By Segment 2, 2024-2033

6.2.5. Canada
6.2.5.1. Historic Market Data & Future Forecasts, 2024-2033
6.2.5.2. Historic Market Data & Future Forecasts, By Segment 1, 2024-2033
6.2.5.3. Historic Market Data & Future Forecasts, By Segment 2, 2024-2033

6.3. Europe
6.3.1. Historic Market Data & Future Forecasts, 2024-2033
6.3.2. Historic Market Data & Future Forecasts, By Segment 1, 2024-2033
6.3.3. Historic Market Data & Future Forecasts, By Segment 2, 2024-2033

6.3.4. UK
6.3.4.1. Historic Market Data & Future Forecasts, 2024-2033
6.3.4.2. Historic Market Data & Future Forecasts, By Segment 1, 2024-2033
6.3.4.3. Historic Market Data & Future Forecasts, By Segment 2, 2024-2033

6.3.5. Germany
6.3.5.1. Historic Market Data & Future Forecasts, 2024-2033
6.3.5.2. Historic Market Data & Future Forecasts, By Segment 1, 2024-2033
6.3.5.3. Historic Market Data & Future Forecasts, By Segment 2, 2024-2033

6.3.6. France
6.3.6.1. Historic Market Data & Future Forecasts, 2024-2033
6.3.6.2. Historic Market Data & Future Forecasts, By Segment 1, 2024-2033
6.3.6.3. Historic Market Data & Future Forecasts, By Segment 2, 2024-2033

6.4. Asia Pacific
6.4.1. Historic Market Data & Future Forecasts, 2024-2033
6.4.2. Historic Market Data & Future Forecasts, By Segment 1, 2024-2033
6.4.3. Historic Market Data & Future Forecasts, By Segment 2, 2024-2033

6.4.4. China
6.4.4.1. Historic Market Data & Future Forecasts, 2024-2033
6.4.4.2. Historic Market Data & Future Forecasts, By Segment 1, 2024-2033
6.4.4.3. Historic Market Data & Future Forecasts, By Segment 2, 2024-2033

6.4.5. India
6.4.5.1. Historic Market Data & Future Forecasts, 2024-2033
6.4.5.2. Historic Market Data & Future Forecasts, By Segment 1, 2024-2033
6.4.5.3. Historic Market Data & Future Forecasts, By Segment 2, 2024-2033

6.4.6. Japan
6.4.6.1. Historic Market Data & Future Forecasts, 2024-2033
6.4.6.2. Historic Market Data & Future Forecasts, By Segment 1, 2024-2033
6.4.6.3. Historic Market Data & Future Forecasts, By Segment 2, 2024-2033

6.4.7. South Korea
6.4.7.1. Historic Market Data & Future Forecasts, 2024-2033
6.4.7.2. Historic Market Data & Future Forecasts, By Segment 1, 2024-2033
6.4.7.3. Historic Market Data & Future Forecasts, By Segment 2, 2024-2033

6.5. Latin America
6.5.1. Historic Market Data & Future Forecasts, 2024-2033
6.5.2. Historic Market Data & Future Forecasts, By Segment 1, 2024-2033
6.5.3. Historic Market Data & Future Forecasts, By Segment 2, 2024-2033

6.5.4. Brazil
6.5.4.1. Historic Market Data & Future Forecasts, 2024-2033
6.5.4.2. Historic Market Data & Future Forecasts, By Segment 1, 2024-2033
6.5.4.3. Historic Market Data & Future Forecasts, By Segment 2, 2024-2033

6.5.5. Mexico
6.5.5.1. Historic Market Data & Future Forecasts, 2024-2033
6.5.5.2. Historic Market Data & Future Forecasts, By Segment 1, 2024-2033
6.5.5.3. Historic Market Data & Future Forecasts, By Segment 2, 2024-2033

6.6. Middle East & Africa
6.6.1. Historic Market Data & Future Forecasts, 2024-2033
6.6.2. Historic Market Data & Future Forecasts, By Segment 1, 2024-2033
6.6.3. Historic Market Data & Future Forecasts, By Segment 2, 2024-2033

6.6.4. UAE
6.6.4.1. Historic Market Data & Future Forecasts, 2024-2033
6.6.4.2. Historic Market Data & Future Forecasts, By Segment 1, 2024-2033
6.6.4.3. Historic Market Data & Future Forecasts, By Segment 2, 2024-2033

6.6.5. Saudi Arabia
6.6.5.1. Historic Market Data & Future Forecasts, 2024-2033
6.6.5.2. Historic Market Data & Future Forecasts, By Segment 1, 2024-2033
6.6.5.3. Historic Market Data & Future Forecasts, By Segment 2, 2024-2033

6.6.6. South Africa
6.6.6.1. Historic Market Data & Future Forecasts, 2024-2033
6.6.6.2. Historic Market Data & Future Forecasts, By Segment 1, 2024-2033
6.6.6.3. Historic Market Data & Future Forecasts, By Segment 2, 2024-2033

Chapter 7. Competitive Landscape

7.1. Competitive Heatmap Analysis, 2023
7.2. Competitive Product Analysis

7.3. Company 1
7.3.1. Company Description
7.3.2. Financial Highlights
7.3.3. Product Portfolio
7.3.4. Strategic Initiatives

7.4. Company 2
7.4.1. Company Description
7.4.2. Financial Highlights
7.4.3. Product Portfolio
7.4.4. Strategic Initiatives

7.5. Company 3
7.5.1. Company Description
7.5.2. Financial Highlights
7.5.3. Product Portfolio
7.5.4. Strategic Initiatives

7.6. Company 4
7.6.1. Company Description
7.6.2. Financial Highlights
7.6.3. Product Portfolio
7.6.4. Strategic Initiatives

7.7. Company 5
7.7.1. Company Description
7.7.2. Financial Highlights
7.7.3. Product Portfolio
7.7.4. Strategic Initiatives

7.8. Company 6
7.8.1. Company Description
7.8.2. Financial Highlights
7.8.3. Product Portfolio
7.8.4. Strategic Initiatives

7.9. Company 7
7.9.1. Company Description
7.9.2. Financial Highlights
7.9.3. Product Portfolio
7.9.4. Strategic Initiatives

7.10. Company 8
7.10.1. Company Description
7.10.2. Financial Highlights
7.10.3. Product Portfolio
7.10.4. Strategic Initiatives

7.11. Company 9
7.11.1. Company Description
7.11.2. Financial Highlights
7.11.3. Product Portfolio
7.11.4. Strategic Initiatives

7.12. Company 10
7.12.1. Company Description
7.12.2. Financial Highlights
7.12.3. Product Portfolio
7.12.4. Strategic Initiatives

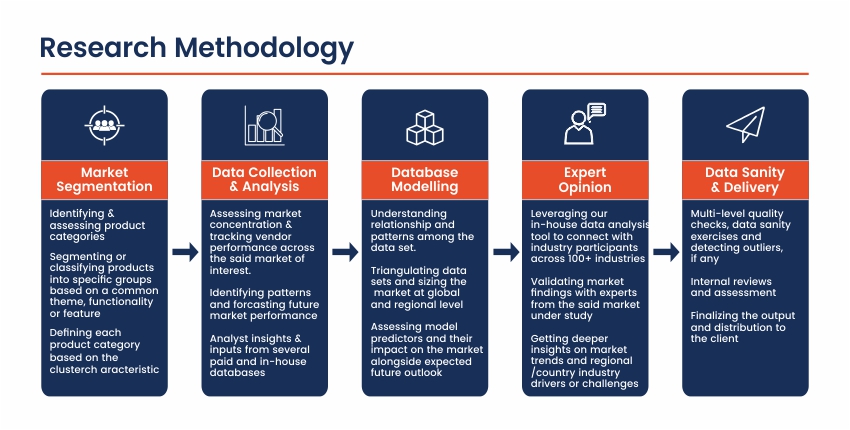
Research Methodology

Frequently Asked Questions About This Report

Choose License Type

$2,430
$2,970
$3,510

Our salient features

Best Solution

We will assist you in comprehending the value propositions of various reports across multiple domains and recommend the optimal solution to meet your research requirements.

Customized Research

Our team of analysts and consultants provide assistance for customized research requirements

Max ROI

Guaranteed maximum assistance to help you get your reports at the optimum prices, thereby ensuring maximum returns on investment.

24/7 Support

24X7 availability to help you through the buying process as well as answer any of your doubts.

Get a free sample report

This free sample study provides a comprehensive overview of the report, including an executive summary, market segments, complete analysis, country-level analysis, and more.

Our Clients

We've Received Your Request

We Thank You for filling out your requirements. Our sales team will get in touch with you shortly.