Table of Contents:
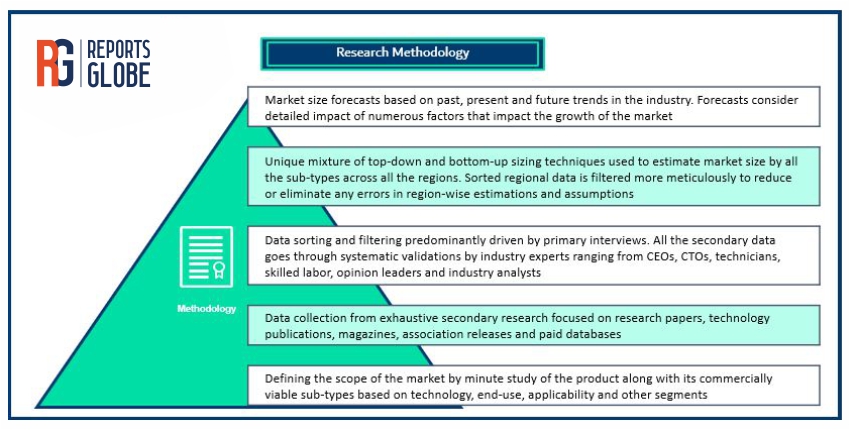
Chapter 1. Research Methodology & Data Sources
1.1. Data Analysis Models
1.2. Research Scope & Assumptions
1.3. List of Primary & Secondary Data Sources
Chapter 2. Executive Summary
Chapter 3. Leak Detection and Repair (LDAR) Market: Industry Analysis
3.1. Market segmentation
3.2. Supply chain analysis
3.3. Porter’s 5 forces analysis
3.4. PEST analysis
3.5. Market Dynamics
3.5.1. Market driver analysis
3.5.2. Market restraint analysis
3.5.3. Market opportunity analysis
3.6. Company Market Share Analysis, 2021
Chapter 4. Leak Detection and Repair (LDAR) Market: Technology Insights
4.1. Global Technology Historic Market Data & Future Forecasts, 2018-2029
4.2. Volatile Organic Compounds (VOC) Analyzer
4.2.1. Historic Market Data & Future Forecasts, 2018-2029
4.2.2. Historic Market Data & Future Forecasts by Region, 2018-2029
4.3. Optical Gas Imaging (OGI)
4.3.1. Historic Market Data & Future Forecasts, 2018-2029
4.3.2. Historic Market Data & Future Forecasts by Region, 2018-2029
4.4. Laser Absorption Spectroscopy
4.4.1. Historic Market Data & Future Forecasts, 2018-2029
4.4.2. Historic Market Data & Future Forecasts by Region, 2018-2029
4.5. Ambient/Mobile Leak Monitoring
4.5.1. Historic Market Data & Future Forecasts, 2018-2029
4.5.2. Historic Market Data & Future Forecasts by Region, 2018-2029
4.6. Acoustic Leak Detection
4.6.1. Historic Market Data & Future Forecasts, 2018-2029
4.6.2. Historic Market Data & Future Forecasts by Region, 2018-2029
4.7. Audio-Visual-Olfactory Inspection
4.7.1. Historic Market Data & Future Forecasts, 2018-2029
4.7.2. Historic Market Data & Future Forecasts by Region, 2018-2029
Chapter 5. Leak Detection and Repair (LDAR) Market: Product Insights
5.1. Global Product Historic Market Data & Future Forecasts, 2018-2029
5.2. Handheld Gas Detectors
5.2.1. Historic Market Data & Future Forecasts, 2018-2029
5.2.2. Historic Market Data & Future Forecasts by Region, 2018-2029
5.3. UAV-Based Detectors
5.3.1. Historic Market Data & Future Forecasts, 2018-2029
5.3.2. Historic Market Data & Future Forecasts by Region, 2018-2029
5.4. Vehicle-based Detectors
5.4.1. Historic Market Data & Future Forecasts, 2018-2029
5.4.2. Historic Market Data & Future Forecasts by Region, 2018-2029
5.5. Manned Aircraft Detectors
5.5.1. Historic Market Data & Future Forecasts, 2018-2029
5.5.2. Historic Market Data & Future Forecasts by Region, 2018-2029
Chapter 6. Leak Detection and Repair (LDAR) Market: Regional Insights
6.1. Leak Detection and Repair (LDAR) Market Data & Future Forecasts, By Region 2018-2029
6.2. North America
6.2.1. Historic Market Data & Future Forecasts, 2018-2029
6.2.2. Historic Market Data & Future Forecasts, By Technology, 2018-2029
6.2.3. Historic Market Data & Future Forecasts, By Product, 2018-2029
6.2.4. U.S.
6.2.4.1. Historic Market Data & Future Forecasts, 2018-2029
6.2.4.2. Historic Market Data & Future Forecasts, By Technology, 2018-2029
6.2.4.3. Historic Market Data & Future Forecasts, By Product, 2018-2029
6.2.5. Canada
6.2.5.1. Historic Market Data & Future Forecasts, 2018-2029
6.2.5.2. Historic Market Data & Future Forecasts, By Technology, 2018-2029
6.2.5.3. Historic Market Data & Future Forecasts, By Product, 2018-2029
6.3. Europe
6.3.1. Historic Market Data & Future Forecasts, 2018-2029
6.3.2. Historic Market Data & Future Forecasts, By Technology, 2018-2029
6.3.3. Historic Market Data & Future Forecasts, By Product, 2018-2029
6.3.4. U.K.
6.3.4.1. Historic Market Data & Future Forecasts, 2018-2029
6.3.4.2. Historic Market Data & Future Forecasts, By Technology, 2018-2029
6.3.4.3. Historic Market Data & Future Forecasts, By Product, 2018-2029
6.3.5. Germany
6.3.5.1. Historic Market Data & Future Forecasts, 2018-2029
6.3.5.2. Historic Market Data & Future Forecasts, By Technology, 2018-2029
6.3.5.3. Historic Market Data & Future Forecasts, By Product, 2018-2029
6.3.6. France
6.3.6.1. Historic Market Data & Future Forecasts, 2018-2029
6.3.6.2. Historic Market Data & Future Forecasts, By Technology, 2018-2029
6.3.6.3. Historic Market Data & Future Forecasts, By Product, 2018-2029
6.4. Asia Pacific
6.4.1. Historic Market Data & Future Forecasts, 2018-2029
6.4.2. Historic Market Data & Future Forecasts, By Technology, 2018-2029
6.4.3. Historic Market Data & Future Forecasts, By Product, 2018-2029
6.4.4. China
6.4.4.1. Historic Market Data & Future Forecasts, 2018-2029
6.4.4.2. Historic Market Data & Future Forecasts, By Technology, 2018-2029
6.4.4.3. Historic Market Data & Future Forecasts, By Product, 2018-2029
6.4.5. India
6.4.5.1. Historic Market Data & Future Forecasts, 2018-2029
6.4.5.2. Historic Market Data & Future Forecasts, By Technology, 2018-2029
6.4.5.3. Historic Market Data & Future Forecasts, By Product, 2018-2029
6.4.6. Japan
6.4.6.1. Historic Market Data & Future Forecasts, 2018-2029
6.4.6.2. Historic Market Data & Future Forecasts, By Technology, 2018-2029
6.4.6.3. Historic Market Data & Future Forecasts, By Product, 2018-2029
6.4.7. South Korea
6.4.7.1. Historic Market Data & Future Forecasts, 2018-2029
6.4.7.2. Historic Market Data & Future Forecasts, By Technology, 2018-2029
6.4.7.3. Historic Market Data & Future Forecasts, By Product, 2018-2029
6.5. Latin America
6.5.1. Historic Market Data & Future Forecasts, 2018-2029
6.5.2. Historic Market Data & Future Forecasts, By Technology, 2018-2029
6.5.3. Historic Market Data & Future Forecasts, By Product, 2018-2029
6.5.4. Brazil
6.5.4.1. Historic Market Data & Future Forecasts, 2018-2029
6.5.4.2. Historic Market Data & Future Forecasts, By Technology, 2018-2029
6.5.4.3. Historic Market Data & Future Forecasts, By Product, 2018-2029
6.5.5. Mexico
6.5.5.1. Historic Market Data & Future Forecasts, 2018-2029
6.5.5.2. Historic Market Data & Future Forecasts, By Technology, 2018-2029
6.5.5.3. Historic Market Data & Future Forecasts, By Product, 2018-2029
6.6. Middle East & Africa
6.6.1. Historic Market Data & Future Forecasts, 2018-2029
6.6.2. Historic Market Data & Future Forecasts, By Technology, 2018-2029
6.6.3. Historic Market Data & Future Forecasts, By Product, 2018-2029
6.6.4. UAE
6.6.4.1. Historic Market Data & Future Forecasts, 2018-2029
6.6.4.2. Historic Market Data & Future Forecasts, By Technology, 2018-2029
6.6.4.3. Historic Market Data & Future Forecasts, By Product, 2018-2029
6.6.5. South Africa
6.6.5.1. Historic Market Data & Future Forecasts, 2018-2029
6.6.5.2. Historic Market Data & Future Forecasts, By Technology, 2018-2029
6.6.5.3. Historic Market Data & Future Forecasts, By Product, 2018-2029
Chapter 7. Company Profiles
7.1. Rebellion Photonics
7.1.1. Company Description
7.1.2. Financial Highlights
7.1.3. Product Portfolio
7.1.4. Strategic Initiatives
7.2. Physical Sciences Inc.
7.2.1. Company Description
7.2.2. Financial Highlights
7.2.3. Product Portfolio
7.2.4. Strategic Initiatives
7.3. Aeris Technologies, Inc.
7.3.1. Company Description
7.3.2. Financial Highlights
7.3.3. Product Portfolio
7.3.4. Strategic Initiatives
7.4. IBM Thomas J. Watson Research Center
7.4.1. Company Description
7.4.2. Financial Highlights
7.4.3. Product Portfolio
7.4.4. Strategic Initiatives
7.5. Bridger Photonics, Inc.
7.5.1. Company Description
7.5.2. Financial Highlights
7.5.3. Product Portfolio
7.5.4. Strategic Initiatives
7.6. LI-COR, Inc.
7.6.1. Company Description
7.6.2. Financial Highlights
7.6.3. Product Portfolio
7.6.4. Strategic Initiatives
7.7. Duke University
7.7.1. Company Description
7.7.2. Financial Highlights
7.7.3. Product Portfolio
7.7.4. Strategic Initiatives
7.8. Colorado State University
7.8.1. Company Description
7.8.2. Financial Highlights
7.8.3. Product Portfolio
7.8.4. Strategic Initiatives
7.9. Palo Alto Research Center
7.9.1. Company Description
7.9.2. Financial Highlights
7.9.3. Product Portfolio
7.9.4. Strategic Initiatives
7.10. Maxion Technologies Inc.
7.10.1. Company Description
7.10.2. Financial Highlights
7.10.3. Product Portfolio
7.10.4. Strategic Initiatives
List of Tables:
Table 1 Leak Detection and Repair (LDAR) Market Market Data & Future Forecasts, 2018-2029(USD Billion)
Table 2 Leak Detection and Repair (LDAR) Market Data & Future Forecasts, By Region, 2018-2029(USD Billion)
Table 3 Leak Detection and Repair (LDAR) Market Data & Future Forecasts, By Technology, 2018-2029(USD Billion)
Table 4 Volatile Organic Compounds (VOC) Analyzer Market Data & Future Forecasts, 2018-2029(USD Billion)
Table 5 Optical Gas Imaging (OGI) Market Data & Future Forecasts, 2018-2029(USD Billion)
Table 6 Laser Absorption Spectroscopy Market Data & Future Forecasts, 2018-2029(USD Billion)
Table 7 Ambient/Mobile Leak Monitoring Market Data & Future Forecasts, 2018-2029(USD Billion)
Table 8 Acoustic Leak Detection Market Data & Future Forecasts, 2018-2029(USD Billion)
Table 9 Audio-Visual-Olfactory Inspection Market Data & Future Forecasts, 2018-2029(USD Billion)
Table 10 Leak Detection and Repair (LDAR) Market Data & Future Forecasts, By Product, 2018-2029(USD Billion)
Table 11 Handheld Gas Detectors Market Data & Future Forecasts, 2018-2029(USD Billion)
Table 12 UAV-Based Detectors Market Data & Future Forecasts, 2018-2029(USD Billion)
Table 13 Vehicle-based Detectors Market Data & Future Forecasts, 2018-2029(USD Billion)
Table 14 Manned Aircraft Detectors Market Data & Future Forecasts, 2018-2029(USD Billion)
Table 15 North America Leak Detection and Repair (LDAR) Market Data & Future Forecasts, 2018-2029(USD Billion)
Table 16 North America Leak Detection and Repair (LDAR) Market Data & Future Forecasts, By Technology, 2018-2029(USD Billion)
Table 17 North America Leak Detection and Repair (LDAR) Market Data & Future Forecasts, By Product, 2018-2029(USD Billion)
Table 18 U.S. Leak Detection and Repair (LDAR) Market Data & Future Forecasts, 2018-2029(USD Billion)
Table 19 U.S. Leak Detection and Repair (LDAR) Market Data & Future Forecasts, By Technology, 2018-2029(USD Billion)
Table 20 U.S. Leak Detection and Repair (LDAR) Market Data & Future Forecasts, By Product, 2018-2029(USD Billion)
Table 21 Canada Leak Detection and Repair (LDAR) Market Data & Future Forecasts, 2018-2029(USD Billion)
Table 22 Canada Leak Detection and Repair (LDAR) Market Data & Future Forecasts, By Technology, 2018-2029(USD Billion)
Table 23 Canada Leak Detection and Repair (LDAR) Market Data & Future Forecasts, By Product, 2018-2029(USD Billion)
Table 24 Europe Leak Detection and Repair (LDAR) Market Data & Future Forecasts, 2018-2029(USD Billion)
Table 25 Europe Leak Detection and Repair (LDAR) Market Data & Future Forecasts, By Technology, 2018-2029(USD Billion)
Table 26 Europe Leak Detection and Repair (LDAR) Market Data & Future Forecasts, By Product, 2018-2029(USD Billion)
Table 27 U.K. Leak Detection and Repair (LDAR) Market Data & Future Forecasts, 2018-2029(USD Billion)
Table 28 U.K. Leak Detection and Repair (LDAR) Market Data & Future Forecasts, By Technology, 2018-2029(USD Billion)
Table 29 U.K. Market Leak Detection and Repair (LDAR) Data & Future Forecasts, By Product, 2018-2029(USD Billion)
Table 30 Germany Leak Detection and Repair (LDAR) Market Data & Future Forecasts, 2018-2029(USD Billion)
Table 31 Germany Leak Detection and Repair (LDAR) Market Data & Future Forecasts, By Technology, 2018-2029(USD Billion)
Table 32 Germany Leak Detection and Repair (LDAR) Market Data & Future Forecasts, By Product, 2018-2029(USD Billion)
Table 33 France Leak Detection and Repair (LDAR) Market Data & Future Forecasts, 2018-2029(USD Billion)
Table 34 France Leak Detection and Repair (LDAR) Market Data & Future Forecasts, By Technology, 2018-2029(USD Billion)
Table 35 France Leak Detection and Repair (LDAR) Market Data & Future Forecasts, By Product, 2018-2029(USD Billion)
Table 36 Asia Pacific Leak Detection and Repair (LDAR) Market Data & Future Forecasts, 2018-2029(USD Billion)
Table 37 Asia Pacific Leak Detection and Repair (LDAR) Market Data & Future Forecasts, By Technology, 2018-2029(USD Billion)
Table 38 Asia Pacific Leak Detection and Repair (LDAR) Market Data & Future Forecasts, By Product, 2018-2029(USD Billion)
Table 39 China Leak Detection and Repair (LDAR) Market Data & Future Forecasts, 2018-2029(USD Billion)
Table 40 China Leak Detection and Repair (LDAR) Market Data & Future Forecasts, By Technology, 2018-2029(USD Billion)
Table 41 China Leak Detection and Repair (LDAR) Market Data & Future Forecasts, By Product, 2018-2029(USD Billion)
Table 42 India Leak Detection and Repair (LDAR) Market Data & Future Forecasts, 2018-2029(USD Billion)
Table 43 India Leak Detection and Repair (LDAR) Market Data & Future Forecasts, By Technology, 2018-2029(USD Billion)
Table 44 India Leak Detection and Repair (LDAR) Market Data & Future Forecasts, By Product, 2018-2029(USD Billion)
Table 45 Japan Leak Detection and Repair (LDAR) Market Data & Future Forecasts, 2018-2029(USD Billion)
Table 46 Japan Leak Detection and Repair (LDAR) Market Data & Future Forecasts, By Technology, 2018-2029(USD Billion)
Table 47 apan Leak Detection and Repair (LDAR) Market Data & Future Forecasts, By Product, 2018-2029(USD Billion)
Table 48 South Korea Leak Detection and Repair (LDAR) Market Data & Future Forecasts, 2018-2029(USD Billion)
Table 49 South Korea Leak Detection and Repair (LDAR) Market Data & Future Forecasts, By Technology, 2018-2029(USD Billion)
Table 50 South Korea Leak Detection and Repair (LDAR) Market Data & Future Forecasts, By Product, 2018-2029(USD Billion)
Table 51 Latin America Leak Detection and Repair (LDAR) Market Data & Future Forecasts, 2018-2029(USD Billion)
Table 52 Latin America Leak Detection and Repair (LDAR) Market Data & Future Forecasts, By Technology, 2018-2029(USD Billion)
Table 53 Latin America Leak Detection and Repair (LDAR) Market Data & Future Forecasts, By Product, 2018-2029(USD Billion)
Table 54 Brazil Leak Detection and Repair (LDAR) Market Data & Future Forecasts, 2018-2029(USD Billion)
Table 55 Brazil Leak Detection and Repair (LDAR) Market Data & Future Forecasts, By Technology, 2018-2029(USD Billion)
Table 56 Brazil Leak Detection and Repair (LDAR) Market Data & Future Forecasts, By Product, 2018-2029(USD Billion)
Table 57 Mexico Leak Detection and Repair (LDAR) Market Data & Future Forecasts, 2018-2029(USD Billion)
Table 58 Mexico Leak Detection and Repair (LDAR) Market Data & Future Forecasts, By Technology, 2018-2029(USD Billion)
Table 59 Mexico Leak Detection and Repair (LDAR) Market Data & Future Forecasts, By Product, 2018-2029(USD Billion)
Table 60 Middle East & Africa Leak Detection and Repair (LDAR) Market Data & Future Forecasts, 2018-2029(USD Billion)
Table 61 Middle East & Africa Leak Detection and Repair (LDAR) Market Data & FutureForecasts, By Technology, 2018-2029(USD Billion)
Table 62 Middle East & Africa Leak Detection and Repair (LDAR) Market Data & Future Forecasts, By Product, 2018-2029(USD Billion)
Table 63 UAE Leak Detection and Repair (LDAR) Market Data & Future Forecasts, 2018-2029(USD Billion)
Table 64 UAE Leak Detection and Repair (LDAR) Market Data & Future Forecasts, By Technology, 2018-2029(USD Billion)
Table 65 UAE Leak Detection and Repair (LDAR) Market Data & Future Forecasts, By Product, 2018-2029(USD Billion)
Table 66 South Africa Leak Detection and Repair (LDAR) Market Data & Future Forecasts, 2018-2029(USD Billion)
Table 67 South Africa Leak Detection and Repair (LDAR) Market Data & Future Forecasts, By Technology, 2018-2029(USD Billion)
Table 68 South Africa Leak Detection and Repair (LDAR) Market Data & Future Forecasts, By Product, 2018-2029(USD Billion)
List of Figures
Fig.1 Data Analysis Model
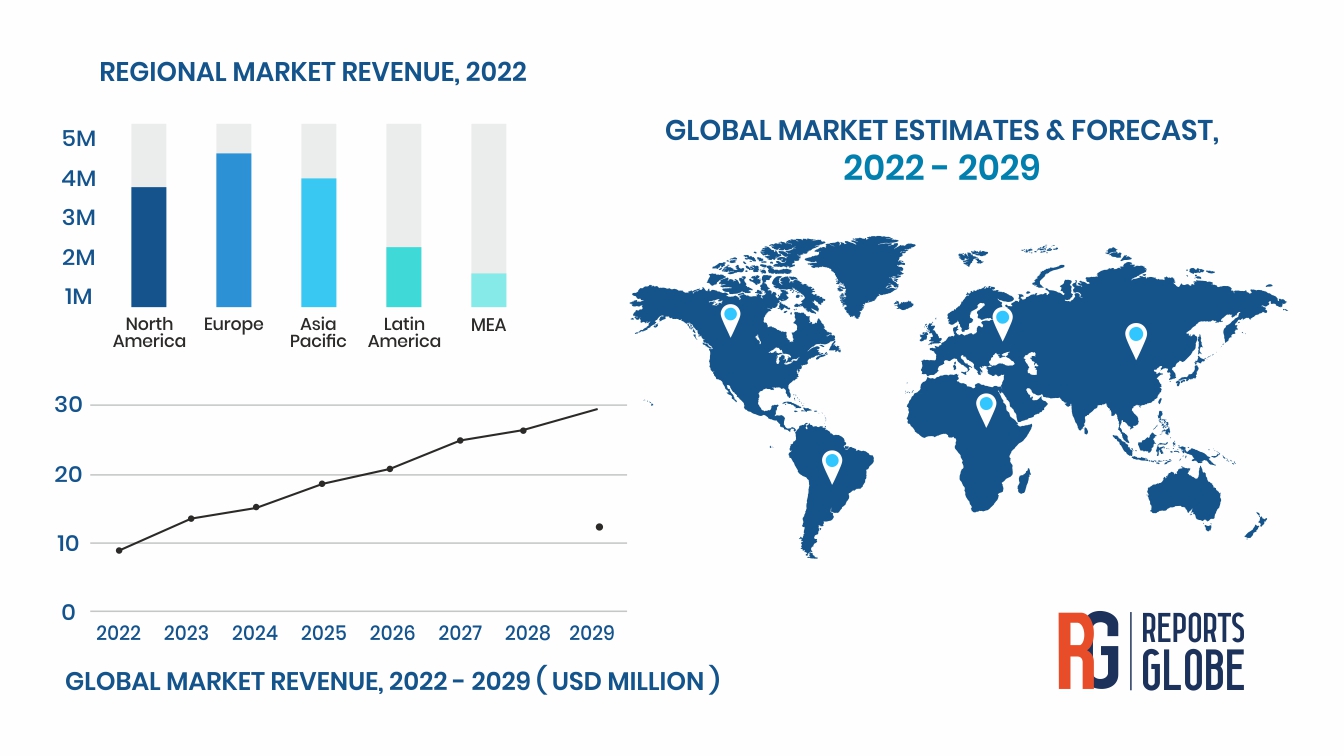
Fig.2 Leak Detection and Repair (LDAR) Market, by 2018-2029(USD Billion)
Fig.3 Leak Detection and Repair (LDAR) Market Segmentation
Fig.4 Supply chain analysis
Fig.5 Leak Detection and Repair (LDAR) Market Driver Anlaysis
Fig.6 Leak Detection and Repair (LDAR) Market Restraint Analysis
Fig.7 Leak Detection and Repair (LDAR) Market Opportunity Analysis
Fig.8 Porters 5 Forces Model
Fig.9 PEST Analysis- Leak Detection and Repair (LDAR) Market
Fig.10 Company Market Share Analysis, 2021