L Band Synthetic Aperture Radar Market Size, Share, Growth, Trends, Statistics Analysis Report and By Segment Forecasts 2024 to 2033

Market Overview

The L Band Synthetic Aperture Radar (SAR) market has witnessed significant growth owing to its capabilities in all-weather, day-and-night imaging, making it crucial for various applications including defense, agriculture, forestry, and environmental monitoring. L Band SAR operates at a wavelength longer than other radar bands, enabling better penetration through vegetation and soil, which enhances its utility in applications requiring ground penetration and biomass estimation. The market has seen advancements in sensor technology, data processing capabilities, and integration with other satellite systems, driving its adoption across different sectors globally.
Key Takeaways of the Market

  • L Band SAR offers superior penetration capabilities through vegetation and soil, making it ideal for applications such as forestry management, land cover mapping, and agricultural monitoring.
  • The market is characterized by increasing demand from defense and security sectors due to SAR’s ability to provide high-resolution imaging in adverse weather conditions.
  • Technological advancements in SAR systems, including miniaturization, enhanced data processing algorithms, and integration with unmanned aerial vehicles (UAVs), are expanding market opportunities.
  • Growing investments in space-based SAR constellations and satellite networks are bolstering the market growth, driven by the need for continuous global coverage and rapid revisit times.

Market Driver

The adoption of L Band SAR is primarily driven by its unique capabilities compared to other radar bands. These drivers include:

L Band SAR offers excellent penetration capabilities through vegetation and soil, making it suitable for applications such as agriculture, forestry, and environmental monitoring. The ability to penetrate foliage enables SAR to monitor ground conditions, measure biomass, and assess forest health without the limitations posed by cloud cover or darkness. This capability is particularly valuable in regions where environmental monitoring and disaster management require reliable data acquisition under adverse weather conditions.

Moreover, the defense and security sectors increasingly rely on SAR for reconnaissance, surveillance, and intelligence gathering. L Band SAR’s ability to operate effectively in all weather conditions and its penetration capability through various types of terrain and foliage make it indispensable for defense applications. Military forces worldwide utilize SAR for target detection, identification of changes in the battlefield environment, and monitoring of border areas, enhancing situational awareness and operational effectiveness.

Furthermore, advancements in SAR technology, including improvements in imaging resolution, data processing algorithms, and integration with satellite networks, are driving market growth. Miniaturization of SAR systems has enabled their deployment on smaller platforms such as UAVs, expanding their application scope in areas such as disaster response, precision agriculture, and infrastructure monitoring.

Market Restraint

Despite its advantages, the L Band SAR market faces certain challenges that hinder its widespread adoption:

One of the primary constraints is the high cost associated with developing and deploying SAR systems. The development of SAR satellites and ground infrastructure requires substantial investments in research and development, manufacturing, and operational deployment. The high initial investment costs may deter potential users, especially in emerging economies and smaller organizations with limited budgets for remote sensing applications.

Additionally, the complexity of SAR data processing and interpretation poses challenges for end-users without specialized expertise. SAR data requires advanced processing techniques to extract meaningful information, including image enhancement, feature extraction, and change detection. The complexity of data processing workflows may limit the adoption of SAR among users who lack the necessary technical skills or resources to effectively utilize SAR-derived information.

Moreover, regulatory restrictions and licensing requirements for SAR data usage and dissemination pose barriers to market growth. SAR data, particularly high-resolution imagery with sensitive geographical information, may be subject to export controls and restrictions imposed by national and international regulatory authorities. Compliance with regulatory frameworks adds complexity and operational costs to SAR data acquisition and distribution, impacting market accessibility and competitiveness.

Market Opportunity

The L Band SAR market presents several opportunities for growth and expansion:

The increasing demand for real-time and actionable intelligence across various sectors, including agriculture, forestry, disaster management, and infrastructure monitoring, provides significant growth opportunities for SAR providers. SAR’s ability to deliver timely and accurate information under all weather conditions enables its integration into decision-support systems for enhanced operational efficiency and risk management.

Furthermore, the integration of SAR with other remote sensing technologies, such as optical imaging and hyperspectral sensing, offers synergistic benefits for comprehensive Earth observation and monitoring applications. Multi-sensor data fusion enables enhanced spatial and spectral resolution capabilities, providing deeper insights into environmental changes, natural resource management, and urban planning.

Additionally, the emergence of new applications for SAR in areas such as urban monitoring, coastal zone management, and climate change assessment expands market opportunities. SAR’s ability to monitor urban growth, detect land subsidence, and assess coastal erosion supports sustainable development initiatives and resilience planning in response to environmental challenges.

Moreover, advancements in SAR technology, including the development of next-generation SAR satellites with improved spatial resolution, spectral sensitivity, and data processing capabilities, are expected to drive market expansion. The deployment of SAR constellations and satellite networks offering high revisit frequencies and global coverage enhances data accessibility and supports real-time monitoring applications.

Market Segment Analysis

  1. Defense and Security

The defense and security segment is a significant user of L Band SAR technology due to its critical role in reconnaissance, surveillance, and intelligence gathering. SAR systems provide defense forces with persistent surveillance capabilities, enabling them to monitor large areas of interest and detect changes in the battlefield environment. The ability of L Band SAR to operate day and night and in adverse weather conditions enhances situational awareness and supports mission planning and execution.

Military applications of L Band SAR include target detection, identification of military assets, and monitoring of border areas for security threats. SAR’s penetration capability through foliage and its ability to distinguish between natural and man-made features contribute to its effectiveness in military operations. Moreover, SAR-equipped platforms such as aircraft, satellites, and UAVs provide flexibility in deployment and operational versatility, meeting diverse defense requirements.

The integration of SAR with electronic warfare systems, intelligence analysis tools, and command and control networks enhances the operational effectiveness of defense forces. SAR-derived intelligence supports decision-making processes, enhances force protection measures, and contributes to mission success in complex operational environments. As defense budgets continue to prioritize modernization and technological advancements, the demand for L Band SAR systems is expected to grow, driven by the need for enhanced situational awareness and operational capabilities.

  1. Agriculture and Forestry

The agriculture and forestry segment represents another key application area for L Band SAR technology, leveraging its capabilities in monitoring land cover, biomass estimation, and crop health assessment. SAR’s ability to penetrate through vegetation and soil provides valuable insights into agricultural productivity, soil moisture content, and crop growth stages, supporting precision farming practices and resource management.

In agriculture, L Band SAR is used for crop monitoring, yield prediction, and irrigation management, helping farmers optimize resource allocation and improve crop yields. SAR-derived information on soil moisture levels and vegetation dynamics enables timely interventions, such as irrigation scheduling and pest management, to mitigate crop stress and enhance agricultural productivity. The integration of SAR with geographic information systems (GIS) and agricultural decision support tools facilitates data-driven farming practices and sustainable agricultural development.

Similarly, in forestry management, L Band SAR supports forest inventory, monitoring of deforestation and illegal logging activities, and assessment of forest health. SAR’s ability to penetrate dense forest canopies and detect changes in forest structure and biomass facilitates forest resource management and conservation efforts. SAR data is used to map forest cover, monitor biodiversity, and assess the impact of natural disturbances such as wildfires and insect infestations on forest ecosystems.

The adoption of L Band SAR in agriculture and forestry is driven by increasing demand for accurate and reliable remote sensing technologies to support food security initiatives, sustainable land use practices, and environmental stewardship. As global population growth and climate change pose challenges to agricultural productivity and natural resource management, SAR-based solutions play a crucial role in addressing these challenges and promoting resilient agricultural and forestry practices.

Regional Analysis

The regional analysis of the L Band SAR market highlights significant trends and opportunities across different geographical regions:

North America

North America dominates the L Band SAR market, driven by technological advancements, extensive defense spending, and strong government support for space-based remote sensing initiatives. The United States, in particular, is a major contributor to the market, with leading aerospace and defense companies investing in SAR technology for military applications, environmental monitoring, and disaster response.

The region’s advanced infrastructure and expertise in SAR data processing and analysis contribute to its leadership in SAR-based applications such as agriculture, forestry, and infrastructure monitoring. The integration of SAR with unmanned aerial systems (UAS) and satellite constellations supports national security priorities and enhances situational awareness across various domains.

Moreover, North America’s robust research and development ecosystem fosters innovation in SAR sensor technology, data analytics, and application development. Collaborative efforts between government agencies, research institutions, and industry stakeholders drive advancements in SAR capabilities and expand market opportunities in emerging sectors such as autonomous vehicles, smart cities, and environmental sustainability.

Europe

Europe is a key market for L Band SAR technology, characterized by significant investments in Earth observation satellites, environmental monitoring, and scientific research. The European Space Agency (ESA) and national space agencies in countries such as Germany, France, and Italy play a pivotal role in promoting SAR-based applications for agriculture, forestry, and climate change mitigation.

The Copernicus program, led by the European Union (EU), includes SAR missions such as Sentinel-1, which provide open-access SAR data for environmental monitoring, disaster management, and maritime surveillance. The integration of SAR with Copernicus services enhances Europe’s capacity for sustainable development, resource management, and resilience planning in response to natural and man-made hazards.

Furthermore, Europe’s strong emphasis on environmental sustainability and climate action drives the adoption of SAR technology in carbon monitoring, biodiversity conservation, and land-use planning. SAR-derived information supports policy-making decisions, enhances ecosystem resilience, and contributes to achieving sustainable development goals (SDGs) outlined by the United Nations.

Asia Pacific

Asia Pacific is emerging as a lucrative market for L Band SAR technology, fueled by rapid economic growth, urbanization, and increasing investments in space-based infrastructure. Countries such as China, India, and Japan are investing in SAR satellites and remote sensing capabilities to

Competitive Analysis

The L Band SAR market is characterized by intense competition among key players aiming to enhance their market presence through technological advancements, strategic partnerships, and expansion into emerging application areas. Key players in the market include:

  • Airbus Defence and Space
  • Thales Group
  • Leonardo S.p.A.
  • Northrop Grumman Corporation
  • Lockheed Martin Corporation
  • Israel Aerospace Industries Ltd. (IAI)
  • TerraSAR-X

These companies dominate the L Band SAR market with their robust portfolios of SAR systems, satellite platforms, and comprehensive solutions for defense, environmental monitoring, and commercial applications. They focus on developing next-generation SAR sensors with enhanced resolution, data processing capabilities, and operational efficiency to meet evolving customer requirements and technological advancements.

Strategic partnerships and collaborations play a crucial role in the competitive landscape of the L Band SAR market. Companies form alliances with government agencies, research institutions, and industry stakeholders to leverage collective expertise, accelerate innovation, and expand market reach. Collaborative efforts in satellite constellation deployments, data analytics, and application development strengthen competitive positions and enable comprehensive solutions for global customers.

Moreover, market players invest significantly in research and development to drive technological innovation and maintain competitive edge. Investments in SAR sensor technology, data processing algorithms, artificial intelligence (AI), and machine learning (ML) enhance the performance, accuracy, and reliability of SAR systems across diverse applications. Continuous advancements in SAR capabilities enable industry leaders to address emerging market trends and customer demands effectively.

The competitive landscape is further shaped by regulatory compliance, intellectual property rights, and market entry barriers. Companies navigate regulatory frameworks for SAR data usage, export controls, and licensing requirements to ensure compliance with national and international regulations. Intellectual property protection strategies safeguard proprietary technologies, innovations, and competitive advantages in the global market.

Overall, competitive rivalry in the L Band SAR market is driven by innovation, technological leadership, strategic partnerships, and market expansion initiatives. Key players strive to capitalize on growth opportunities in defense, agriculture, forestry, environmental monitoring, and disaster management sectors by delivering advanced SAR solutions tailored to customer needs and market dynamics.

Key Industry Developments

  • Increasing deployment of L Band SAR satellites for global environmental monitoring and disaster response initiatives.
  • Advancements in SAR sensor technology, including higher resolution imaging and enhanced data processing capabilities.
  • Integration of SAR with unmanned aerial systems (UAS) and satellite constellations to enhance operational flexibility and coverage.
  • Strategic collaborations between space agencies, defense contractors, and commercial entities to expand SAR application domains.
  • Development of AI and ML algorithms for SAR data analysis, enabling automated information extraction and decision support.

Future Outlook

The future outlook for the L Band SAR market is promising, driven by technological advancements, increasing demand for real-time Earth observation data, and growing applications across various sectors. Key trends shaping the market’s trajectory include:

The adoption of SAR technology in disaster management, climate change monitoring, and sustainable development initiatives is expected to accelerate, supported by global efforts to enhance environmental resilience and mitigate natural hazards. SAR’s capability to provide timely and accurate information for disaster preparedness, response, and recovery efforts will drive its integration into national and international disaster management frameworks.

Moreover, advancements in miniaturization and cost reduction of SAR systems will facilitate their deployment on small satellite platforms and UAVs, expanding market accessibility and application diversity. The emergence of commercial SAR constellations and satellite networks offering high revisit rates and global coverage will cater to growing demand for frequent and reliable Earth observation data across industry verticals.

Furthermore, the integration of SAR with emerging technologies such as 5G communication networks, IoT devices, and autonomous systems will create new opportunities for data fusion, sensor synergy, and cross-domain applications. SAR’s role in supporting smart city initiatives, precision agriculture, infrastructure monitoring, and transportation logistics will enhance urban resilience and operational efficiency in increasingly interconnected environments.

In conclusion, the L Band SAR market is poised for substantial growth driven by technological innovation, expanding application domains, and strategic collaborations. Market players are expected to focus on enhancing SAR capabilities, broadening market reach, and leveraging emerging technologies to capitalize on evolving customer demands and market opportunities.

Market Segmentation

  • By Application:
    • Defense and Security
    • Agriculture and Forestry
    • Environmental Monitoring
    • Disaster Management
    • Infrastructure Monitoring
  • By End-User:
    • Government and Defense
    • Commercial
    • Research and Academic Institutions
  • By Region:
    • North America
    • Europe
    • Asia Pacific
    • Latin America
    • Middle East and Africa
  • By Type:
    • Satellite-based SAR
    • Airborne SAR
    • UAV-based SAR
  • By Frequency Band:
    • L Band SAR
    • X Band SAR
    • C Band SAR

Table of Contents

Chapter 1. Research Methodology & Data Sources

1.1. Data Analysis Models
1.2. Research Scope & Assumptions
1.3. List of Primary & Secondary Data Sources 

Chapter 2. Executive Summary

2.1. Market Overview
2.2. Segment Overview
2.3. Market Size and Estimates, 2021 to 2033
2.4. Market Size and Estimates, By Segments, 2021 to 2033

Chapter 3. Industry Analysis

3.1. Market Segmentation
3.2. Market Definitions and Assumptions
3.3. Supply chain analysis
3.4. Porter’s five forces analysis
3.5. PEST analysis
3.6. Market Dynamics
3.6.1. Market Driver Analysis
3.6.2. Market Restraint analysis
3.6.3. Market Opportunity Analysis
3.7. Competitive Positioning Analysis, 2023
3.8. Key Player Ranking, 2023

Chapter 4. Market Segment Analysis- Segment 1

4.1.1. Historic Market Data & Future Forecasts, 2024-2033
4.1.2. Historic Market Data & Future Forecasts by Region, 2024-2033

Chapter 5. Market Segment Analysis- Segment 2

5.1.1. Historic Market Data & Future Forecasts, 2024-2033
5.1.2. Historic Market Data & Future Forecasts by Region, 2024-2033

Chapter 6. Regional or Country Market Insights

** Reports focusing on a particular region or country will contain data unique to that region or country **

6.1. Global Market Data & Future Forecasts, By Region 2024-2033

6.2. North America
6.2.1. Historic Market Data & Future Forecasts, 2024-2033
6.2.2. Historic Market Data & Future Forecasts, By Segment 1, 2024-2033
6.2.3. Historic Market Data & Future Forecasts, By Segment 2, 2024-2033

6.2.4. U.S.
6.2.4.1. Historic Market Data & Future Forecasts, 2024-2033
6.2.4.2. Historic Market Data & Future Forecasts, By Segment 1, 2024-2033
6.2.4.3. Historic Market Data & Future Forecasts, By Segment 2, 2024-2033

6.2.5. Canada
6.2.5.1. Historic Market Data & Future Forecasts, 2024-2033
6.2.5.2. Historic Market Data & Future Forecasts, By Segment 1, 2024-2033
6.2.5.3. Historic Market Data & Future Forecasts, By Segment 2, 2024-2033

6.3. Europe
6.3.1. Historic Market Data & Future Forecasts, 2024-2033
6.3.2. Historic Market Data & Future Forecasts, By Segment 1, 2024-2033
6.3.3. Historic Market Data & Future Forecasts, By Segment 2, 2024-2033

6.3.4. UK
6.3.4.1. Historic Market Data & Future Forecasts, 2024-2033
6.3.4.2. Historic Market Data & Future Forecasts, By Segment 1, 2024-2033
6.3.4.3. Historic Market Data & Future Forecasts, By Segment 2, 2024-2033

6.3.5. Germany
6.3.5.1. Historic Market Data & Future Forecasts, 2024-2033
6.3.5.2. Historic Market Data & Future Forecasts, By Segment 1, 2024-2033
6.3.5.3. Historic Market Data & Future Forecasts, By Segment 2, 2024-2033

6.3.6. France
6.3.6.1. Historic Market Data & Future Forecasts, 2024-2033
6.3.6.2. Historic Market Data & Future Forecasts, By Segment 1, 2024-2033
6.3.6.3. Historic Market Data & Future Forecasts, By Segment 2, 2024-2033

6.4. Asia Pacific
6.4.1. Historic Market Data & Future Forecasts, 2024-2033
6.4.2. Historic Market Data & Future Forecasts, By Segment 1, 2024-2033
6.4.3. Historic Market Data & Future Forecasts, By Segment 2, 2024-2033

6.4.4. China
6.4.4.1. Historic Market Data & Future Forecasts, 2024-2033
6.4.4.2. Historic Market Data & Future Forecasts, By Segment 1, 2024-2033
6.4.4.3. Historic Market Data & Future Forecasts, By Segment 2, 2024-2033

6.4.5. India
6.4.5.1. Historic Market Data & Future Forecasts, 2024-2033
6.4.5.2. Historic Market Data & Future Forecasts, By Segment 1, 2024-2033
6.4.5.3. Historic Market Data & Future Forecasts, By Segment 2, 2024-2033

6.4.6. Japan
6.4.6.1. Historic Market Data & Future Forecasts, 2024-2033
6.4.6.2. Historic Market Data & Future Forecasts, By Segment 1, 2024-2033
6.4.6.3. Historic Market Data & Future Forecasts, By Segment 2, 2024-2033

6.4.7. South Korea
6.4.7.1. Historic Market Data & Future Forecasts, 2024-2033
6.4.7.2. Historic Market Data & Future Forecasts, By Segment 1, 2024-2033
6.4.7.3. Historic Market Data & Future Forecasts, By Segment 2, 2024-2033

6.5. Latin America
6.5.1. Historic Market Data & Future Forecasts, 2024-2033
6.5.2. Historic Market Data & Future Forecasts, By Segment 1, 2024-2033
6.5.3. Historic Market Data & Future Forecasts, By Segment 2, 2024-2033

6.5.4. Brazil
6.5.4.1. Historic Market Data & Future Forecasts, 2024-2033
6.5.4.2. Historic Market Data & Future Forecasts, By Segment 1, 2024-2033
6.5.4.3. Historic Market Data & Future Forecasts, By Segment 2, 2024-2033

6.5.5. Mexico
6.5.5.1. Historic Market Data & Future Forecasts, 2024-2033
6.5.5.2. Historic Market Data & Future Forecasts, By Segment 1, 2024-2033
6.5.5.3. Historic Market Data & Future Forecasts, By Segment 2, 2024-2033

6.6. Middle East & Africa
6.6.1. Historic Market Data & Future Forecasts, 2024-2033
6.6.2. Historic Market Data & Future Forecasts, By Segment 1, 2024-2033
6.6.3. Historic Market Data & Future Forecasts, By Segment 2, 2024-2033

6.6.4. UAE
6.6.4.1. Historic Market Data & Future Forecasts, 2024-2033
6.6.4.2. Historic Market Data & Future Forecasts, By Segment 1, 2024-2033
6.6.4.3. Historic Market Data & Future Forecasts, By Segment 2, 2024-2033

6.6.5. Saudi Arabia
6.6.5.1. Historic Market Data & Future Forecasts, 2024-2033
6.6.5.2. Historic Market Data & Future Forecasts, By Segment 1, 2024-2033
6.6.5.3. Historic Market Data & Future Forecasts, By Segment 2, 2024-2033

6.6.6. South Africa
6.6.6.1. Historic Market Data & Future Forecasts, 2024-2033
6.6.6.2. Historic Market Data & Future Forecasts, By Segment 1, 2024-2033
6.6.6.3. Historic Market Data & Future Forecasts, By Segment 2, 2024-2033

Chapter 7. Competitive Landscape

7.1. Competitive Heatmap Analysis, 2023
7.2. Competitive Product Analysis

7.3. Company 1
7.3.1. Company Description
7.3.2. Financial Highlights
7.3.3. Product Portfolio
7.3.4. Strategic Initiatives

7.4. Company 2
7.4.1. Company Description
7.4.2. Financial Highlights
7.4.3. Product Portfolio
7.4.4. Strategic Initiatives

7.5. Company 3
7.5.1. Company Description
7.5.2. Financial Highlights
7.5.3. Product Portfolio
7.5.4. Strategic Initiatives

7.6. Company 4
7.6.1. Company Description
7.6.2. Financial Highlights
7.6.3. Product Portfolio
7.6.4. Strategic Initiatives

7.7. Company 5
7.7.1. Company Description
7.7.2. Financial Highlights
7.7.3. Product Portfolio
7.7.4. Strategic Initiatives

7.8. Company 6
7.8.1. Company Description
7.8.2. Financial Highlights
7.8.3. Product Portfolio
7.8.4. Strategic Initiatives

7.9. Company 7
7.9.1. Company Description
7.9.2. Financial Highlights
7.9.3. Product Portfolio
7.9.4. Strategic Initiatives

7.10. Company 8
7.10.1. Company Description
7.10.2. Financial Highlights
7.10.3. Product Portfolio
7.10.4. Strategic Initiatives

7.11. Company 9
7.11.1. Company Description
7.11.2. Financial Highlights
7.11.3. Product Portfolio
7.11.4. Strategic Initiatives

7.12. Company 10
7.12.1. Company Description
7.12.2. Financial Highlights
7.12.3. Product Portfolio
7.12.4. Strategic Initiatives

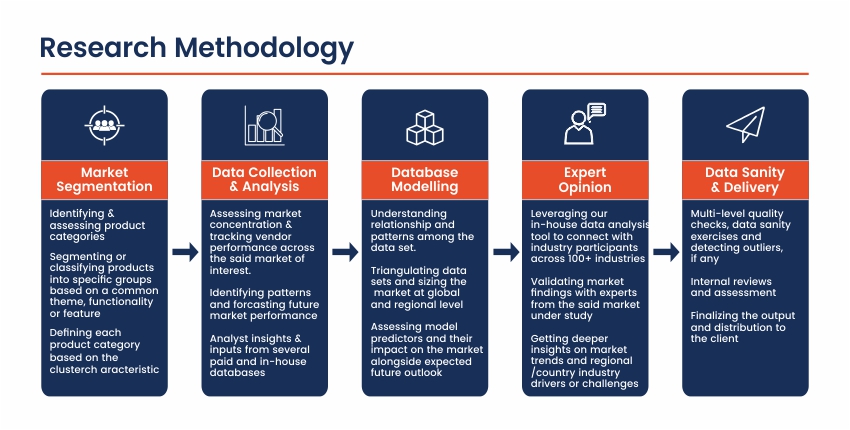
Research Methodology

Frequently Asked Questions About This Report

Choose License Type

$3,240
$3,780
$4,410

Our salient features

Best Solution

We will assist you in comprehending the value propositions of various reports across multiple domains and recommend the optimal solution to meet your research requirements.

Customized Research

Our team of analysts and consultants provide assistance for customized research requirements

Max ROI

Guaranteed maximum assistance to help you get your reports at the optimum prices, thereby ensuring maximum returns on investment.

24/7 Support

24X7 availability to help you through the buying process as well as answer any of your doubts.

Get a free sample report

This free sample study provides a comprehensive overview of the report, including an executive summary, market segments, complete analysis, country-level analysis, and more.

Our Clients

We've Received Your Request

We Thank You for filling out your requirements. Our sales team will get in touch with you shortly.