Table of Contents
Chapter 1. Research Methodology & Data Sources
1.1. Data Analysis Models
1.2. Research Scope & Assumptions
1.3. List of Primary & Secondary Data Sources
Chapter 2. Executive Summary
Chapter 3. Injectable Drug Delivery Market: Industry Analysis
3.1. Market segmentation
3.2. Supply chain analysis
3.3. Porter’s 5 forces analysis
3.4. PEST analysis
3.5. Market Dynamics
3.5.1. Market driver analysis
3.5.2. Market restraint analysis
3.5.3. Market opportunity analysis
3.6. Company Market Share Analysis, 2021
Chapter 4. Injectable Drug Delivery Market: End-User Application Insights
4.1. Global End-User Application Historic Market Data & Future Forecasts, 2018-2029
4.2. Hospital
4.2.1. Historic Market Data & Future Forecasts, 2018-2029
4.2.2. Historic Market Data & Future Forecasts by Region, 2018-2029
4.3. Homecare Settings
4.3.1. Historic Market Data & Future Forecasts, 2018-2029
4.3.2. Historic Market Data & Future Forecasts by Region, 2018-2029
4.4. Others
4.4.1. Historic Market Data & Future Forecasts, 2018-2029
4.4.2. Historic Market Data & Future Forecasts by Region, 2018-2029
Chapter 5. Injectable Drug Delivery Market: Therapeutic Use Insights
5.1. Global Therapeutic Use Historic Market Data & Future Forecasts, 2018-2029
5.2. Autoimmune disorders
5.2.1. Historic Market Data & Future Forecasts, 2018-2029
5.2.2. Historic Market Data & Future Forecasts by Region, 2018-2029
5.3. Hormonal disorders
5.3.1. Historic Market Data & Future Forecasts, 2018-2029
5.3.2. Historic Market Data & Future Forecasts, By Region, 2018-2029
5.4. Oncology
5.4.1. Historic Market Data & Future Forecasts, 2018-2029
5.4.2. Historic Market Data & Future Forecasts by Region, 2018-2029
5.5. Others
5.5.1. Historic Market Data & Future Forecasts, 2018-2029
5.5.2. Historic Market Data & Future Forecasts by Region, 2018-2029
Chapter 6. Injectable Drug Delivery Market: Product Type Insights
6.1. Global Product Type Historic Market Data & Future Forecasts, 2018-2029
6.2. By Devices
6.2.1. Historic Market Data & Future Forecasts, 2018-2029
6.2.2. Historic Market Data & Future Forecasts by Region, 2018-2029
6.3. By Formulations
6.3.1. Historic Market Data & Future Forecasts, 2018-2029
6.3.2. Historic Market Data & Future Forecasts, By Region, 2018-2029
6.4. Others
6.4.1. Historic Market Data & Future Forecasts, 2018-2029
6.4.2. Historic Market Data & Future Forecasts by Region, 2018-2029
Chapter 7. Injectable Drug Delivery Market: Regional Insights
7.1. Global Injectable Drug Delivery Market Data & Future Forecasts, By Region 2018-2029
7.2. North America
7.2.1. Historic Market Data & Future Forecasts, 2018-2029
7.2.2. Historic Market Data & Future Forecasts, By End-User Application, 2018-2029
7.2.3. Historic Market Data & Future Forecasts, By Therapeutic Use, 2018-2029
7.2.4. Historic Market Data & Future Forecasts, By Product Type, 2018-2029
7.2.5. U.S.
7.2.5.1. Historic Market Data & Future Forecasts, 2018-2029
7.2.5.2. Historic Market Data & Future Forecasts, By End-User Application, 2018-2029
7.2.5.3. Historic Market Data & Future Forecasts, By Therapeutic Use, 2018-2029
7.2.5.4. Historic Market Data & Future Forecasts, By Product Type, 2018-2029
7.2.6. Canada
7.2.6.1. Historic Market Data & Future Forecasts, 2018-2029
7.2.6.2. Historic Market Data & Future Forecasts, By End-User Application, 2018-2029
7.2.6.3. Historic Market Data & Future Forecasts, By Therapeutic Use, 2018-2029
7.2.6.4. Historic Market Data & Future Forecasts, By Product Type, 2018-2029
7.3. Europe
7.3.1. Historic Market Data & Future Forecasts, 2018-2029
7.3.2. Historic Market Data & Future Forecasts, By End-User Application, 2018-2029
7.3.3. Historic Market Data & Future Forecasts, By Therapeutic Use, 2018-2029
7.3.4. Historic Market Data & Future Forecasts, By Product Type, 2018-2029
7.3.5. U.K.
7.3.5.1. Historic Market Data & Future Forecasts, 2018-2029
7.3.5.2. Historic Market Data & Future Forecasts, By End-User Application, 2018-2029
7.3.5.3. Historic Market Data & Future Forecasts, By Therapeutic Use, 2018-2029
7.3.5.4. Historic Market Data & Future Forecasts, By Product Type, 2018-2029
7.3.6. Germany
7.3.6.1. Historic Market Data & Future Forecasts, 2018-2029
7.3.6.2. Historic Market Data & Future Forecasts, By End-User Application, 2018-2029
7.3.6.3. Historic Market Data & Future Forecasts, By Therapeutic Use, 2018-2029
7.3.6.4. Historic Market Data & Future Forecasts, By Product Type, 2018-2029
7.3.7. France
7.3.7.1. Historic Market Data & Future Forecasts, 2018-2029
7.3.7.2. Historic Market Data & Future Forecasts, By End-User Application, 2018-2029
7.3.7.3. Historic Market Data & Future Forecasts, By Therapeutic Use, 2018-2029
7.3.7.4. Historic Market Data & Future Forecasts, By Product Type, 2018-2029
7.4. Asia Pacific
7.4.1. Historic Market Data & Future Forecasts, 2018-2029
7.4.2. Historic Market Data & Future Forecasts, By End-User Application, 2018-2029
7.4.3. Historic Market Data & Future Forecasts, By Therapeutic Use, 2018-2029
7.4.4. Historic Market Data & Future Forecasts, By Product Type, 2018-2029
7.4.5. China
7.4.5.1. Historic Market Data & Future Forecasts, 2018-2029
7.4.5.2. Historic Market Data & Future Forecasts, By End-User Application, 2018-2029
7.4.5.3. Historic Market Data & Future Forecasts, By Therapeutic Use, 2018-2029
7.4.5.4. Historic Market Data & Future Forecasts, By Product Type, 2018-2029
7.4.6. India
7.4.6.1. Historic Market Data & Future Forecasts, 2018-2029
7.4.6.2. Historic Market Data & Future Forecasts, By End-User Application, 2018-2029
7.4.6.3. Historic Market Data & Future Forecasts, By Therapeutic Use, 2018-2029
7.4.6.4. Historic Market Data & Future Forecasts, By Product Type, 2018-2029
7.4.7. Japan
7.4.7.1. Historic Market Data & Future Forecasts, 2018-2029
7.4.7.2. Historic Market Data & Future Forecasts, By End-User Application, 2018-2029
7.4.7.3. Historic Market Data & Future Forecasts, By Therapeutic Use, 2018-2029
7.4.7.4. Historic Market Data & Future Forecasts, By Product Type, 2018-2029
7.4.8. South Korea
7.4.8.1. Historic Market Data & Future Forecasts, 2018-2029
7.4.8.2. Historic Market Data & Future Forecasts, By End-User Application, 2018-2029
7.4.8.3. Historic Market Data & Future Forecasts, By Therapeutic Use, 2018-2029
7.4.8.4. Historic Market Data & Future Forecasts, By Product Type, 2018-2029
7.5. Latin America
7.5.1. Historic Market Data & Future Forecasts, 2018-2029
7.5.2. Historic Market Data & Future Forecasts, By End-User Application, 2018-2029
7.5.3. Historic Market Data & Future Forecasts, By Therapeutic Use, 2018-2029
7.5.4. Historic Market Data & Future Forecasts, By Product Type, 2018-2029
7.5.5. Brazil
7.5.5.1. Historic Market Data & Future Forecasts, 2018-2029
7.5.5.2. Historic Market Data & Future Forecasts, By End-User Application, 2018-2029
7.5.5.3. Historic Market Data & Future Forecasts, By Therapeutic Use, 2018-2029
7.5.5.4. Historic Market Data & Future Forecasts, By Product Type, 2018-2029
7.5.6. Mexico
7.5.6.1. Historic Market Data & Future Forecasts, 2018-2029
7.5.6.2. Historic Market Data & Future Forecasts, By End-User Application, 2018-2029
7.5.6.3. Historic Market Data & Future Forecasts, By Therapeutic Use, 2018-2029
7.5.6.4. Historic Market Data & Future Forecasts, By Product Type, 2018-2029
7.6. Middle East & Africa
7.6.1. Historic Market Data & Future Forecasts, 2018-2029
7.6.2. Historic Market Data & Future Forecasts, By End-User Application, 2018-2029
7.6.3. Historic Market Data & Future Forecasts, By Therapeutic Use, 2018-2029
7.6.4. Historic Market Data & Future Forecasts, By Product Type, 2018-2029
7.6.5. UAE
7.6.5.1. Historic Market Data & Future Forecasts, 2018-2029
7.6.5.2. Historic Market Data & Future Forecasts, By End-User Application, 2018-2029
7.6.5.3. Historic Market Data & Future Forecasts, By Therapeutic Use, 2018-2029
7.6.5.4. Historic Market Data & Future Forecasts, By Product Type, 2018-2029
7.6.6. South Africa
7.6.6.1. Historic Market Data & Future Forecasts, 2018-2029
7.6.6.2. Historic Market Data & Future Forecasts, By End-User Application, 2018-2029
7.6.6.3. Historic Market Data & Future Forecasts, By Therapeutic Use, 2018-2029
7.6.6.4. Historic Market Data & Future Forecasts, By Product Type, 2018-2029
Chapter 8. Company Profiles
8.1. Unilife Corporation
8.1.1. Company Description
8.1.2. Financial Highlights
8.1.3. Product Portfolio
8.1.4. Strategic Initiatives
8.2. Elcam Medical
8.2.1. Company Description
8.2.2. Financial Highlights
8.2.3. Product Portfolio
8.2.4. Strategic Initiatives
8.3. Terumo Corporation
8.3.1. Company Description
8.3.2. Financial Highlights
8.3.3. Product Portfolio
8.3.4. Strategic Initiatives
8.4. Alkermes PLC
8.4.1. Company Description
8.4.2. Financial Highlights
8.4.3. Product Portfolio
8.4.4. Strategic Initiatives
8.5. Eli Lilly and Company
8.5.1. Company Description
8.5.2. Financial Highlights
8.5.3. Product Portfolio
8.5.4. Strategic Initiatives
8.6. Becton, Dickinson and Company
8.6.1. Company Description
8.6.2. Financial Highlights
8.6.3. Product Portfolio
8.6.4. Strategic Initiatives
8.7. Schott AG
8.7.1. Company Description
8.7.2. Financial Highlights
8.7.3. Product Portfolio
8.7.4. Strategic Initiatives
8.8. Baxter International, Inc.
8.8.1. Company Description
8.8.2. Financial Highlights
8.8.3. Product Portfolio
8.8.4. Strategic Initiatives
8.9. Pfizer, Inc.
8.9.1. Company Description
8.9.2. Financial Highlights
8.9.3. Product Portfolio
8.9.4. Strategic Initiatives
List of Tables
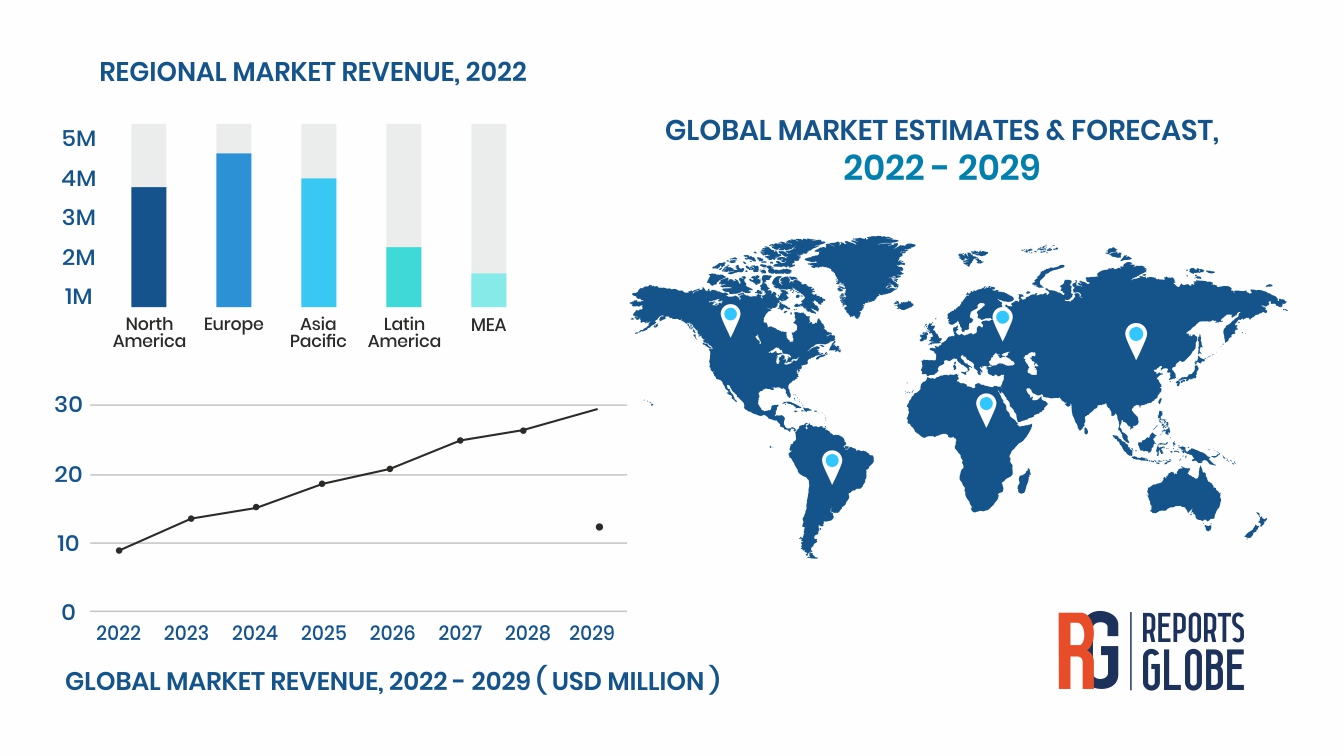
Table 1 Injectable Drug Delivery Market Data & Future Forecasts, 2018-2029 (USD Million)
Table 2 Injectable Drug Delivery Market Data & Future Forecasts, By Region, 2018-2029 (USD Million)
Table 3 Injectable Drug Delivery Market Data & Future Forecasts, By End-User Application, 2018-2029 (USD Million)
Table 4 Injectable Drug Delivery Market Data & Future Forecasts, By Therapeutic Use, 2018-2029 (USD Million)
Table 5 Injectable Drug Delivery Market Data & Future Forecasts, By Product Type, 2018-2029 (USD Million)
Table 6 Hospital Market Data & Future Forecasts, 2018-2029 (USD Million)
Table 7 Homecare Settings Market Data & Future Forecasts, 2018-2029 (USD Million)
Table 8 Others Market Data & Future Forecasts, 2018-2029 (USD Million)
Table 9 Autoimmune disorders Market Data & Future Forecasts, 2018-2029 (USD Million)
Table 10 Hormonal disorders Market Data & Future Forecasts, 2018-2029 (USD Million)
Table 11 Oncology Market Data & Future Forecasts, 2018-2029 (USD Million)
Table 12 Others Market Data & Future Forecasts, 2018-2029 (USD Million)
Table 13 By Devices Market Data & Future Forecasts, 2018-2029 (USD Million)
Table 14 By Formulations Market Data & Future Forecasts, 2018-2029 (USD Million)
Table 15 Others Market Data & Future Forecasts, 2018-2029 (USD Million)
Table 16 North America Injectable Drug Delivery Market Data & Future Forecasts, 2018-2029 (USD Million)
Table 17 North America Injectable Drug Delivery Market Data & Future Forecasts, By End-User Application, 2018-2029 (USD Million)
Table 18 North America Injectable Drug Delivery Market Data & Future Forecasts, By Therapeutic Use, 2018-2029 (USD Million)
Table 19 North America Injectable Drug Delivery Market Data & Future Forecasts, By Product Type, 2018-2029 (USD Million)
Table 20 U.S. Injectable Drug Delivery Market Data & Future Forecasts, 2018-2029 (USD Million)
Table 21 U.S. Injectable Drug Delivery Market Data & Future Forecasts, By End-User Application, 2018-2029 (USD Million)
Table 22 U.S. Injectable Drug Delivery Market Data & Future Forecasts, By Therapeutic Use, 2018-2029 (USD Million)
Table 23 U.S. Injectable Drug Delivery Market Data & Future Forecasts, By Product Type, 2018-2029 (USD Million)
Table 24 Canada Injectable Drug Delivery Market Data & Future Forecasts, 2018-2029 (USD Million)
Table 25 Canada Injectable Drug Delivery Market Data & Future Forecasts, By End-User Application, 2018-2029 (USD Million)
Table 26 Canada Injectable Drug Delivery Market Data & Future Forecasts, By Therapeutic Use, 2018-2029 (USD Million)
Table 27 Canada Injectable Drug Delivery Market Data & Future Forecasts, By Product Type, 2018-2029 (USD Million)
Table 28 Europe Injectable Drug Delivery Market Data & Future Forecasts, 2018-2029 (USD Million)
Table 29 Europe Injectable Drug Delivery Market Data & Future Forecasts, By End-User Application, 2018-2029 (USD Million)
Table 30 Europe Injectable Drug Delivery Market Data & Future Forecasts, By Therapeutic Use, 2018-2029 (USD Million)
Table 31 Europe Injectable Drug Delivery Market Data & Future Forecasts, By Product Type, 2018-2029 (USD Million)
Table 32 U.K. Injectable Drug Delivery Market Data & Future Forecasts, 2018-2029 (USD Million)
Table 33 U.K Injectable Drug Delivery Market Data & Future Forecasts, By End-User Application, 2018-2029 (USD Million)
Table 34 U.K Injectable Drug Delivery Market Data & Future Forecasts, By Therapeutic Use, 2018-2029 (USD Million)
Table 35 U.K Injectable Drug Delivery Market Data & Future Forecasts, By Product Type, 2018-2029 (USD Million)
Table 36 Germany Injectable Drug Delivery Market Data & Future Forecasts, 2018-2029 (USD Million)
Table 37 Germany Injectable Drug Delivery Market Data & Future Forecasts, By End-User Application, 2018-2029 (USD Million)
Table 38 Germany Injectable Drug Delivery Market Data & Future Forecasts, By Therapeutic Use, 2018-2029 (USD Million)
Table 39 Germany Injectable Drug Delivery Market Data & Future Forecasts, By Product Type, 2018-2029 (USD Million)
Table 40 France Injectable Drug Delivery Market Data & Future Forecasts, 2018-2029 (USD Million)
Table 41 France Injectable Drug Delivery Market Data & Future Forecasts, By End-User Application, 2018-2029 (USD Million)
Table 42 France nada Injectable Drug Delivery Market Data & Future Forecasts, By Therapeutic Use, 2018-2029 (USD Million)
Table 43 France Injectable Drug Delivery Market Data & Future Forecasts, By Product Type, 2018-2029 (USD Million)
Table 44 Asia Pacific Injectable Drug Delivery Market Data & Future Forecasts, 2018-2029 (USD Million)
Table 45 Asia Pacific Injectable Drug Delivery Market Data & Future Forecasts, By End-User Application, 2018-2029 (USD Million)
Table 46 Asia Pacific Injectable Drug Delivery Market Data & Future Forecasts, By Therapeutic Use, 2018-2029 (USD Million)
Table 47 Asia Pacific Injectable Drug Delivery Market Data & Future Forecasts, By Product Type, 2018-2029 (USD Million)
Table 48 China Injectable Drug Delivery Market Data & Future Forecasts, 2018-2029 (USD Million)
Table 49 China Injectable Drug Delivery Market Data & Future Forecasts, By End-User Application, 2018-2029 (USD Million)
Table 50 China Injectable Drug Delivery Market Data & Future Forecasts, By Therapeutic Use, 2018-2029 (USD Million)
Table 51 China Injectable Drug Delivery Market Data & Future Forecasts, By Product Type, 2018-2029 (USD Million)
Table 52 India Injectable Drug Delivery Market Data & Future Forecasts, 2018-2029 (USD Million)
Table 53 India Injectable Drug Delivery Market Data & Future Forecasts, By End-User Application, 2018-2029 (USD Million)
Table 54 India Injectable Drug Delivery Market Data & Future Forecasts, By Therapeutic Use, 2018-2029 (USD Million)
Table 55 India Injectable Drug Delivery Market Data & Future Forecasts, By Product Type, 2018-2029 (USD Million)
Table 56 Japan Injectable Drug Delivery Market Data & Future Forecasts, 2018-2029 (USD Million)
Table 57 Japan Injectable Drug Delivery Market Data & Future Forecasts, By End-User Application, 2018-2029 (USD Million)
Table 58 Japan Injectable Drug Delivery Market Data & Future Forecasts, By Therapeutic Use, 2018-2029 (USD Million)
Table 59 Japan Injectable Drug Delivery Market Data & Future Forecasts, By Product Type, 2018-2029 (USD Million)
Table 60 South Korea Injectable Drug Delivery Market Data & Future Forecasts, 2018-2029 (USD Million)
Table 61 South Korea Injectable Drug Delivery Market Data & Future Forecasts, By End-User Application, 2018-2029 (USD Million)
Table 62 South Korea Injectable Drug Delivery Market Data & Future Forecasts, By Therapeutic Use, 2018-2029 (USD Million)
Table 63 South Korea Injectable Drug Delivery Market Data & Future Forecasts, By Product Type, 2018-2029 (USD Million)
Table 64 Latin America Injectable Drug Delivery Market Data & Future Forecasts, 2018-2029 (USD Million)
Table 65 Latin America Injectable Drug Delivery Market Data & Future Forecasts, By End-User Application, 2018-2029 (USD Million)
Table 66 Latin America Injectable Drug Delivery Market Data & Future Forecasts, By Therapeutic Use, 2018-2029 (USD Million)
Table 67 Latin America Injectable Drug Delivery Market Data & Future Forecasts, By Product Type, 2018-2029 (USD Million)
Table 68 Brazil Injectable Drug Delivery Market Data & Future Forecasts, 2018-2029 (USD Million)
Table 69 Brazil Injectable Drug Delivery Market Data & Future Forecasts, By End-User Application, 2018-2029 (USD Million)
Table 70 Brazil Injectable Drug Delivery Market Data & Future Forecasts, By Therapeutic Use, 2018-2029 (USD Million)
Table 71 Brazil Injectable Drug Delivery Market Data & Future Forecasts, By Product Type, 2018-2029 (USD Million)
Table 72 Mexico Injectable Drug Delivery Market Data & Future Forecasts, 2018-2029 (USD Million)
Table 73 Mexico Injectable Drug Delivery Market Data & Future Forecasts, By End-User Application, 2018-2029 (USD Million)
Table 74 Mexico Injectable Drug Delivery Market Data & Future Forecasts, By Therapeutic Use, 2018-2029 (USD Million)
Table 75 Mexico Injectable Drug Delivery Market Data & Future Forecasts, By Product Type, 2018-2029 (USD Million)
Table 76 Middle East & Africa Injectable Drug Delivery Market Data & Future Forecasts, 2018-2029 (USD Million)
Table 77 Middle East & Africa Injectable Drug Delivery Market Data & Future Forecasts, By End-User Application, 2018-2029 (USD Million)
Table 78 Middle East & Africa Injectable Drug Delivery Market Data & Future Forecasts, By Therapeutic Use, 2018-2029 (USD Million)
Table 79 Middle East & Africa Injectable Drug Delivery Market Data & Future Forecasts, By Product Type, 2018-2029 (USD Million)
Table 80 UAE Injectable Drug Delivery Market Data & Future Forecasts, 2018-2029(USD Million)
Table 81 UAE Injectable Drug Delivery Market Data & Future Forecasts, By End-User Application, 2018-2029 (USD Million)
Table 82 UAE Injectable Drug Delivery Market Data & Future Forecasts, By Therapeutic Use, 2018-2029 (USD Million)
Table 83 UAE Injectable Drug Delivery Market Data & Future Forecasts, By Product Type, 2018-2029 (USD Million)
Table 84 South Africa Injectable Drug Delivery Market Data & Future Forecasts, 2018-2029 (USD Million)
Table 85 South Africa Injectable Drug Delivery Market Data & Future Forecasts, By End-User Application, 2018-2029 (USD Million)
Table 86 South Africa Injectable Drug Delivery Market Data & Future Forecasts, By Therapeutic Use, 2018-2029 (USD Million)
Table 87 South Africa Injectable Drug Delivery Market Data & Future Forecasts, By Product Type, 2018-2029 (USD Million)
List of Figures
Fig.1 Data Analysis Model
Fig.2 Injectable Drug Delivery Market, by 2018-2029 (USD Million)
Fig.3 Injectable Drug Delivery Market Segmentation
Fig.4 Supply chain analysis
Fig.5 Injectable Drug Delivery Market Driver Anlaysis
Fig.6 Injectable Drug Delivery Market Restraint Analysis
Fig.7 Injectable Drug Delivery Market Opportunity Analysis
Fig.8 Porters 5 Forces Model
Fig.9 PEST Analysis- Injectable Drug Delivery Market
Fig.10 Company Market Share Analysis, 2021