Global Virus Filtration Market 2022-2029 by Product (Consumables, Instruments, Services), Application, End User, and Region: COVID-19 Impact and Growth Opportunity
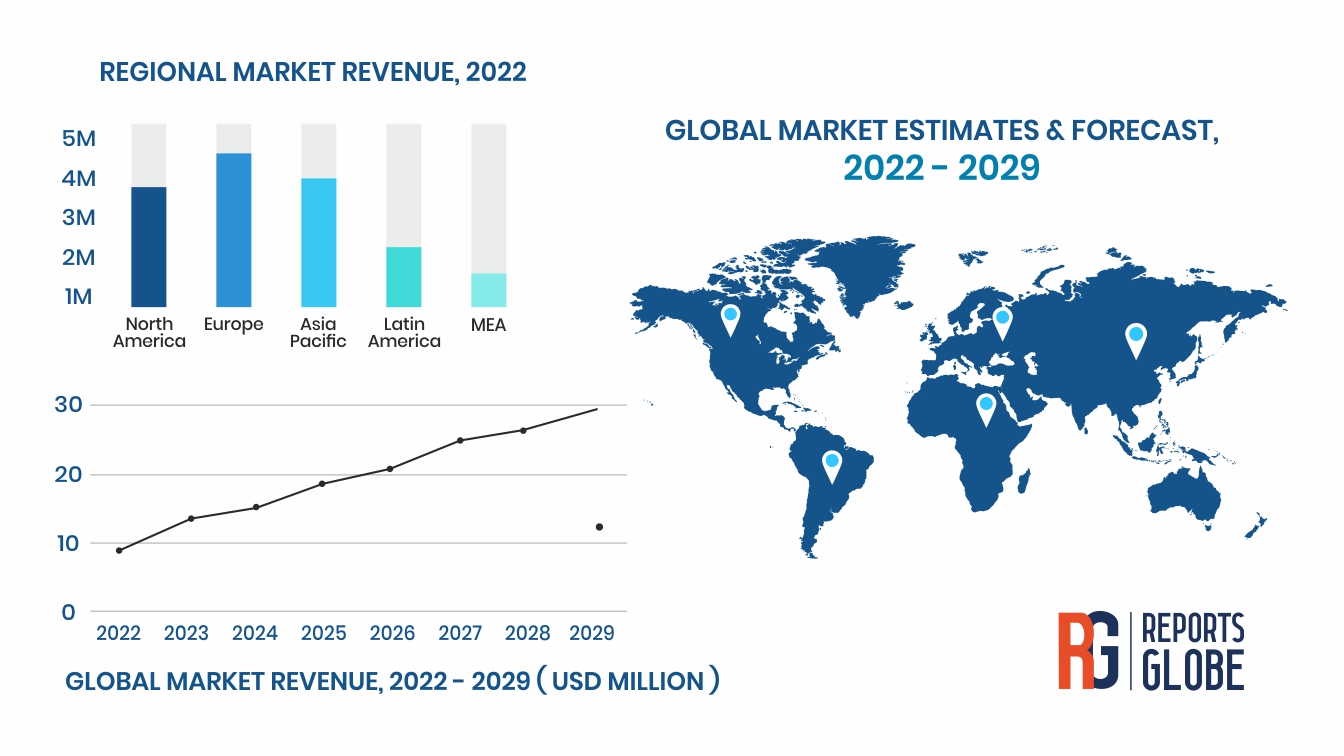
Global virus filtration market will reach $6,275.3 million by 2029, growing by 12.26% annually over 2018-2029 owing to rapid growth of the pharmaceutical and biotechnology industry, increasing investments in R&D, surging need for virus removal and clearance amid COVID-19 pandemic.
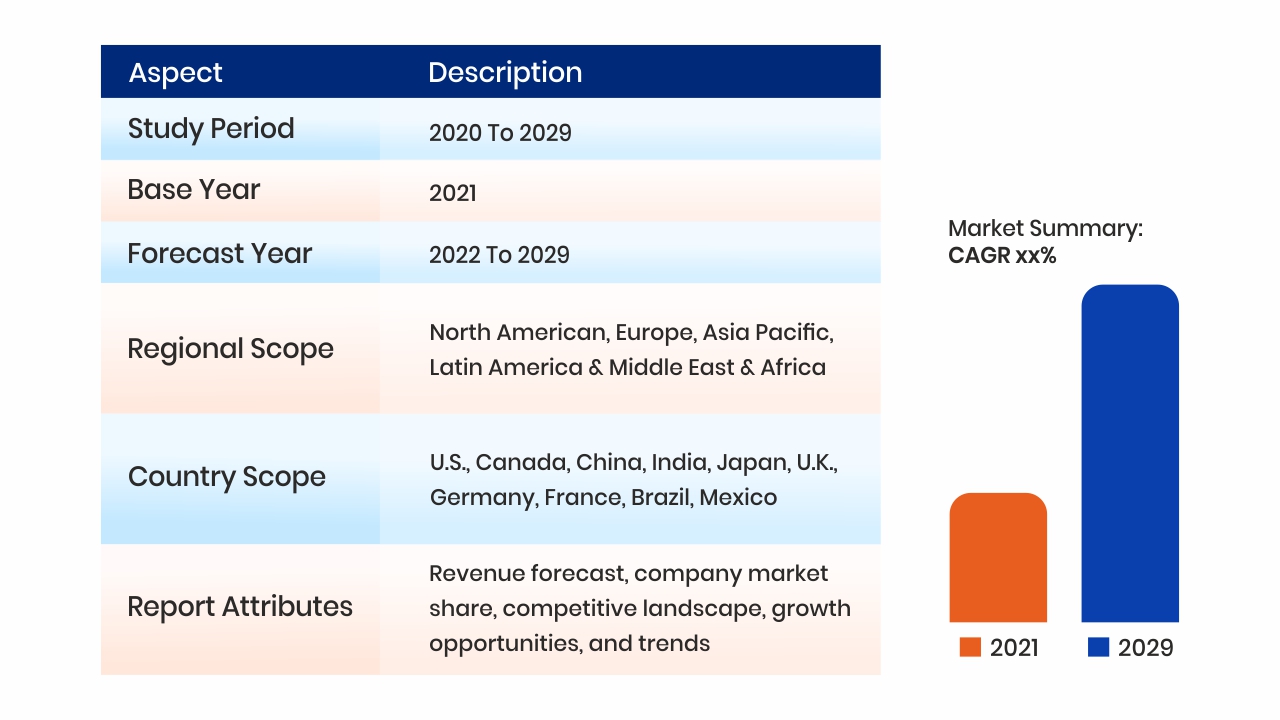
Highlighted with 84 tables and 78 figures, this 157-page report “Global Virus Filtration Market 2022-2029 by Product (Consumables, Instruments, Services), Application, End User, and Region: COVID-19 Impact and Growth Opportunity” is based on a holistic research of the entire global virus filtration market and all its sub-segments through extensively detailed classifications. Profound analysis and assessment are generated from premium primary and secondary information sources with inputs derived from industry professionals across the value chain. The report is based on studies on 2018-2021 and provides a forecast from 2022 to 2029 with 2021 as the base year. (Please note: The report will be updated before delivery so that the latest historical year is the base year and the forecast covers at least 5 years over the base year.)
In-depth qualitative analyses include identification and investigation of the following aspects:
• Market Structure
• Growth Drivers
• Restraints and Challenges
• Emerging Product Trends & Market Opportunities
• Porter’s Fiver Forces
The trend and outlook of global market is forecast in optimistic, balanced, and conservative view by taking into account of COVID-19. The balanced (most likely) projection is used to quantify global virus filtration market in every aspect of the classification from perspectives of Product, Application, End User, and Region.
Based on Product, the global market is segmented into the following sub-markets with annual revenue ($ mn) for 2018-2029 included in each section.
Consumables
Instruments
• Filtration Systems
• Chromatography systems
Services
Based on Application, the global market is segmented into the following sub-markets with annual revenue ($ mn) for 2018-2029 included in each section.
Biological Applications
• Vaccines and Therapeutics
• Blood and Blood Products
• Cellular and Gene Therapy Products
• Tissue and Tissue Products
• Stem Cell Products
Medical Devices
Water Purification
Air Purification
Other Applications
Based on End User, the global market is segmented into the following sub-markets with annual revenue ($ mn) for 2018-2029 included in each section.
• Pharmaceutical and Biotechnology Companies
• Contract Research Organisations (CROs)
• Academic & Research Institutes
• Medical Device Companies
• Other End Users
Geographically, the following regions together with the listed national/local markets are fully investigated:
• APAC (Japan, China, South Korea, Australia, India, and Rest of APAC; Rest of APAC is further segmented into Malaysia, Singapore, Indonesia, Thailand, New Zealand, Vietnam, and Sri Lanka)
• Europe (Germany, UK, France, Spain, Italy, Russia, Rest of Europe; Rest of Europe is further segmented into Belgium, Denmark, Austria, Norway, Sweden, The Netherlands, Poland, Czech Republic, Slovakia, Hungary, and Romania)
• North America (U.S., Canada, and Mexico)
• South America (Brazil, Columbia, Argentina, Rest of South America)
• MEA (Saudi Arabia, UAE, South Africa)
For each region and key country, detailed analysis and data for annual revenue ($ mn) are available for 2018-2029. The breakdown of all regional markets by country and split of key national markets by Product, Application, and End User over the forecast years are also included.
The report also covers current competitive scenario and the predicted trend; and profiles key vendors including market leaders and important emerging players.
Specifically, potential risks associated with investing in global virus filtration market are assayed quantitatively and qualitatively through GMD’s Risk Assessment System. According to the risk analysis and evaluation, Critical Success Factors (CSFs) are generated as a guidance to help investors & stockholders identify emerging opportunities, manage and minimize the risks, develop appropriate business models, and make wise strategies and decisions. Key Players (this may not be a complete list and extra companies can be added upon request):
Asahi Kasei Medical Co., Ltd.
Charles River Laboratories International, Inc.
Clean Cells
General Electric Company
Lonza Group AG
Merck KGaA
MilliporeSigma
Pall Corporation
Sartorius AG
Thermo Fisher Scientific, Inc.
Wuxi Apptec
(Please note: The report will be updated before delivery so that the latest historical year is the base year and the forecast covers at least 5 years over the base year.)
1 Introduction 8
1.1 Industry Definition and Research Scope 8
1.1.1 Industry Definition 8
1.1.2 Research Scope 9
1.2 Research Methodology 12
1.2.1 Overview of Market Research Methodology 12
1.2.2 Market Assumption 13
1.2.3 Secondary Data 13
1.2.4 Primary Data 13
1.2.5 Data Filtration and Model Design 15
1.2.6 Market Size/Share Estimation 16
1.2.7 Research Limitations 17
1.3 Executive Summary 18
2 Market Overview and Dynamics 20
2.1 Market Size and Forecast 20
2.1.1 Impact of COVID-19 on World Economy 21
2.1.2 Impact of COVID-19 on the Market 24
2.2 Major Growth Drivers 26
2.3 Market Restraints and Challenges 29
2.4 Emerging Opportunities and Market Trends 32
2.5 Porter’s Fiver Forces Analysis 36
3 Segmentation of Global Market by Product 40
3.1 Market Overview by Product 40
3.2 Consumables 42
3.3 Instruments 43
3.3.1 Filtration Systems 44
3.3.2 Chromatography systems 45
3.4 Services 46
4 Segmentation of Global Market by Application 47
4.1 Market Overview by Application 47
4.2 Biological Applications 49
4.2.1 Vaccines and Therapeutics 51
4.2.2 Blood and Blood Products 52
4.2.3 Cellular and Gene Therapy Products 53
4.2.4 Tissue and Tissue Products 54
4.2.5 Stem Cell Products 55
4.3 Medical Devices 56
4.4 Water Purification 57
4.5 Air Purification 58
4.6 Other Applications 59
5 Segmentation of Global Market by End User 60
5.1 Market Overview by End User 60
5.2 Pharmaceutical and Biotechnology Companies 62
5.3 Contract Research Organisations (CROs) 63
5.4 Academic & Research Institutes 64
5.5 Medical Device Companies 65
5.6 Other End Users 66
6 Segmentation of Global Market by Region 67
6.1 Geographic Market Overview 2019-2026 67
6.2 North America Market 2019-2026 by Country 71
6.2.1 Overview of North America Market 71
6.2.2 U.S. 74
6.2.3 Canada 78
6.2.4 Mexico 80
6.3 European Market 2019-2026 by Country 82
6.3.1 Overview of European Market 82
6.3.2 UK 85
6.3.3 France 87
6.3.4 Germany 89
6.3.5 Spain 91
6.3.6 Italy 93
6.3.7 Russia 95
6.3.8 Rest of European Market 97
6.4 Asia-Pacific Market 2018-2029 by Country 99
6.4.1 Overview of Asia-Pacific Market 99
6.4.2 China 102
6.4.3 Japan 104
6.4.4 India 107
6.4.5 Australia 109
6.4.6 South Korea 111
6.4.7 Rest of APAC Region 113
6.5 South America Market 2018-2029 by Country 115
6.5.1 Argentina 118
6.5.2 Brazil 120
6.5.3 Columbia 122
6.5.4 Rest of South America Market 124
6.6 MEA Market 2018-2029 by Country 125
6.6.1 UAE 128
6.6.2 Saudi Arabia 130
6.6.3 South Africa 132
6.6.4 Other National Markets 134
7 Competitive Landscape 135
7.1 Overview of Key Vendors 135
7.2 New Product Launch, Partnership, Investment, and M&A 138
7.3 Company Profiles 139
Asahi Kasei Medical Co., Ltd. 139
Charles River Laboratories International, Inc. 141
Clean Cells 142
General Electric Company 143
Lonza Group AG 144
Merck KGaA 145
MilliporeSigma 146
Pall Corporation 147
Sartorius AG 148
Thermo Fisher Scientific, Inc. 149
Wuxi Apptec 150
8 Investing in Global Market: Risk Assessment and Management 151
8.1 Risk Evaluation of Global Market 151
8.2 Critical Success Factors (CSFs) 154
Related Reports and Products 157
Key Players (this may not be a complete list and extra companies can be added upon request):
Asahi Kasei Medical Co., Ltd.
Charles River Laboratories International, Inc.
Clean Cells
General Electric Company
Lonza Group AG
Merck KGaA
MilliporeSigma
Pall Corporation
Sartorius AG
Thermo Fisher Scientific, Inc.
Wuxi Apptec
Table 1. Snapshot of Global Virus Filtration Market in Balanced Perspective, 2018-2029 19
Table 2. Growth Rate of World Real GDP, 2017-2021 22
Table 3. Main Product Trends and Market Opportunities in Global Virus Filtration Market 32
Table 4. Global Virus Filtration Market by Product, 2018-2029, $ mn 40
Table 5. Global Virus Filtration Market: Instruments by Technology, 2018-2029, $ mn 43
Table 6. Global Virus Filtration Market by Application, 2018-2029, $ mn 47
Table 7. Global Virus Filtration Market: Biological Applications by Segment, 2018-2029, $ mn 50
Table 8. Global Virus Filtration Market by End User, 2018-2029, $ mn 60
Table 9. Global Virus Filtration Market by Region, 2018-2029, $ mn 68
Table 10. Leading National Virus Filtration Market, 2018 and 2029, $ mn 70
Table 11. North America Virus Filtration Market by Country, 2018-2029, $ mn 73
Table 12. U.S. Virus Filtration Market by Product, 2018-2029, $ mn 76
Table 13. U.S. Virus Filtration Market by Application, 2018-2029, $ mn 76
Table 14. U.S. Virus Filtration Market by End User, 2018-2029, $ mn 76
Table 15. Canada Virus Filtration Market by Product, 2018-2029, $ mn 79
Table 16. Canada Virus Filtration Market by Application, 2018-2029, $ mn 79
Table 17. Canada Virus Filtration Market by End User, 2018-2029, $ mn 79
Table 18. Mexico Virus Filtration Market by Product, 2018-2029, $ mn 81
Table 19. Mexico Virus Filtration Market by Application, 2018-2029, $ mn 81
Table 20. Mexico Virus Filtration Market by End User, 2018-2029, $ mn 81
Table 21. Europe Virus Filtration Market by Country, 2018-2029, $ mn 84
Table 22. UK Virus Filtration Market by Product, 2018-2029, $ mn 86
Table 23. UK Virus Filtration Market by Application, 2018-2029, $ mn 86
Table 24. UK Virus Filtration Market by End User, 2018-2029, $ mn 86
Table 25. France Virus Filtration Market by Product, 2018-2029, $ mn 88
Table 26. France Virus Filtration Market by Application, 2018-2029, $ mn 88
Table 27. France Virus Filtration Market by End User, 2018-2029, $ mn 88
Table 28. Germany Virus Filtration Market by Product, 2018-2029, $ mn 90
Table 29. Germany Virus Filtration Market by Application, 2018-2029, $ mn 90
Table 30. Germany Virus Filtration Market by End User, 2018-2029, $ mn 90
Table 31. Spain Virus Filtration Market by Product, 2018-2029, $ mn 92
Table 32. Spain Virus Filtration Market by Application, 2018-2029, $ mn 92
Table 33. Spain Virus Filtration Market by End User, 2018-2029, $ mn 92
Table 34. Italy Virus Filtration Market by Product, 2018-2029, $ mn 94
Table 35. Italy Virus Filtration Market by Application, 2018-2029, $ mn 94
Table 36. Italy Virus Filtration Market by End User, 2018-2029, $ mn 94
Table 37. Russia Virus Filtration Market by Product, 2018-2029, $ mn 96
Table 38. Russia Virus Filtration Market by Application, 2018-2029, $ mn 96
Table 39. Russia Virus Filtration Market by End User, 2018-2029, $ mn 96
Table 40. Virus Filtration Market in Rest of Europe by Country, 2018-2029, $ mn 98
Table 41. APAC Virus Filtration Market by Country, 2018-2029, $ mn 101
Table 42. China Virus Filtration Market by Product, 2018-2029, $ mn 103
Table 43. China Virus Filtration Market by Application, 2018-2029, $ mn 103
Table 44. China Virus Filtration Market by End User, 2018-2029, $ mn 103
Table 45. Japan Virus Filtration Market by Product, 2018-2029, $ mn 106
Table 46. Japan Virus Filtration Market by Application, 2018-2029, $ mn 106
Table 47. Japan Virus Filtration Market by End User, 2018-2029, $ mn 106
Table 48. India Virus Filtration Market by Product, 2018-2029, $ mn 108
Table 49. India Virus Filtration Market by Application, 2018-2029, $ mn 108
Table 50. India Virus Filtration Market by End User, 2018-2029, $ mn 108
Table 51. Australia Virus Filtration Market by Product, 2018-2029, $ mn 110
Table 52. Australia Virus Filtration Market by Application, 2018-2029, $ mn 110
Table 53. Australia Virus Filtration Market by End User, 2018-2029, $ mn 110
Table 54. South Korea Virus Filtration Market by Product, 2018-2029, $ mn 112
Table 55. South Korea Virus Filtration Market by Application, 2018-2029, $ mn 112
Table 56. South Korea Virus Filtration Market by End User, 2018-2029, $ mn 112
Table 57. Virus Filtration Market in Rest of APAC by Country, 2018-2029, $ mn 114
Table 58. South America Virus Filtration Market by Country, 2018-2029, $ mn 117
Table 59. Argentina Virus Filtration Market by Product, 2018-2029, $ mn 119
Table 60. Argentina Virus Filtration Market by Application, 2018-2029, $ mn 119
Table 61. Argentina Virus Filtration Market by End User, 2018-2029, $ mn 119
Table 62. Brazil Virus Filtration Market by Product, 2018-2029, $ mn 121
Table 63. Brazil Virus Filtration Market by Application, 2018-2029, $ mn 121
Table 64. Brazil Virus Filtration Market by End User, 2018-2029, $ mn 121
Table 65. Columbia Virus Filtration Market by Product, 2018-2029, $ mn 123
Table 66. Columbia Virus Filtration Market by Application, 2018-2029, $ mn 123
Table 67. Columbia Virus Filtration Market by End User, 2018-2029, $ mn 123
Table 68. MEA Virus Filtration Market by Country, 2018-2029, $ mn 127
Table 69. UAE Virus Filtration Market by Product, 2018-2029, $ mn 129
Table 70. UAE Virus Filtration Market by Application, 2018-2029, $ mn 129
Table 71. UAE Virus Filtration Market by End User, 2018-2029, $ mn 129
Table 72. Saudi Arabia Virus Filtration Market by Product, 2018-2029, $ mn 131
Table 73. Saudi Arabia Virus Filtration Market by Application, 2018-2029, $ mn 131
Table 74. Saudi Arabia Virus Filtration Market by End User, 2018-2029, $ mn 131
Table 75. South Africa Virus Filtration Market by Product, 2018-2029, $ mn 133
Table 76. South Africa Virus Filtration Market by Application, 2018-2029, $ mn 133
Table 77. South Africa Virus Filtration Market by End User, 2018-2029, $ mn 133
Table 78. Asahi Kasei Medical Co., Ltd.: Company Snapshot 139
Table 79. Asahi Kasei Medical Co., Ltd.: Business Segmentation 139
Table 80. Asahi Kasei Medical Co., Ltd.: Product Portfolio 140
Table 81. Asahi Kasei Medical Co., Ltd.: Revenue, 2016-2018, $ mn 140
Table 82. Asahi Kasei Medical Co., Ltd.: Recent Developments 140
Table 83. Risk Evaluation for Investing in Global Market, 2018-2029 152
Table 84. Critical Success Factors and Key Takeaways 155
Figure 1. Research Method Flow Chart 12
Figure 2. Breakdown of Primary Research 14
Figure 3. Bottom-up Approach and Top-down Approach for Market Estimation 16
Figure 4. Global Market Forecast in Optimistic, Conservative and Balanced Perspectives, 2018-2029 18
Figure 5. Global Virus Filtration Market, 2018-2029, $ mn 20
Figure 6. Impact of COVID-19 on Business 24
Figure 7. Primary Drivers and Impact Factors of Global Virus Filtration Market 26
Figure 8. Primary Restraints and Impact Factors of Global Virus Filtration Market 29
Figure 9. Investment Opportunity Analysis 33
Figure 10. Porter’s Fiver Forces Analysis of Global Virus Filtration Market 36
Figure 11. Breakdown of Global Virus Filtration Market by Product, 2018-2029, % of Revenue 40
Figure 12. Contribution to Global 2022-2029Cumulative Revenue by Product, Value ($ mn) and Share (%) 41
Figure 13. Global Virus Filtration Market: Consumables, 2018-2029, $ mn 42
Figure 14. Global Virus Filtration Market: Instruments, 2018-2029, $ mn 43
Figure 15. Global Virus Filtration Market: Filtration Systems, 2018-2029, $ mn 44
Figure 16. Global Virus Filtration Market: Chromatography systems, 2018-2029, $ mn 45
Figure 17. Global Virus Filtration Market: Services, 2018-2029, $ mn 46
Figure 18. Breakdown of Global Virus Filtration Market by Application, 2018-2029, % of Revenue 47
Figure 19. Contribution to Global 2022-2029Cumulative Revenue by Application, Value ($ mn) and Share (%) 48
Figure 20. Global Virus Filtration Market: Biological Applications, 2018-2029, $ mn 49
Figure 21. Global Virus Filtration Market: Vaccines and Therapeutics, 2018-2029, $ mn 51
Figure 22. Global Virus Filtration Market: Blood and Blood Products, 2018-2029, $ mn 52
Figure 23. Global Virus Filtration Market: Cellular and Gene Therapy Products, 2018-2029, $ mn 53
Figure 24. Global Virus Filtration Market: Tissue and Tissue Products, 2018-2029, $ mn 54
Figure 25. Global Virus Filtration Market: Stem Cell Products, 2018-2029, $ mn 55
Figure 26. Global Virus Filtration Market: Medical Devices, 2018-2029, $ mn 56
Figure 27. Global Virus Filtration Market: Water Purification, 2018-2029, $ mn 57
Figure 28. Global Virus Filtration Market: Air Purification, 2018-2029, $ mn 58
Figure 29. Global Virus Filtration Market: Other Applications, 2018-2029, $ mn 59
Figure 30. Breakdown of Global Virus Filtration Market by End User, 2018-2029, % of Revenue 61
Figure 31. Contribution to Global 2022-2029Cumulative Revenue by End User, Value ($ mn) and Share (%) 61
Figure 32. Global Virus Filtration Market: Pharmaceutical and Biotechnology Companies, 2018-2029, $ mn 62
Figure 33. Global Virus Filtration Market: Contract Research Organisations (CROs), 2018-2029, $ mn 63
Figure 34. Global Virus Filtration Market: Academic & Research Institutes, 2018-2029, $ mn 64
Figure 35. Global Virus Filtration Market: Medical Device Companies, 2018-2029, $ mn 65
Figure 36. Global Virus Filtration Market: Other End Users, 2018-2029, $ mn 66
Figure 37. Global Market Snapshot by Region 67
Figure 38. Geographic Spread of Worldwide Virus Filtration Market, 2018-2029, % of Revenue 68
Figure 39. Contribution to Global 2022-2029Cumulative Revenue by Region, Value ($ mn) and Share (%) 69
Figure 40. North American Virus Filtration Market, 2018-2029, $ mn 72
Figure 41. Breakdown of North America Virus Filtration Market by Country, 2018 and 2029, % of Revenue 72
Figure 42. Contribution to North America 2022-2029Cumulative Revenue by Country, Value ($ mn) and Share (%) 73
Figure 43. U.S. Virus Filtration Market, 2018-2029, $ mn 75
Figure 44. Canada Virus Filtration Market, 2018-2029, $ mn 78
Figure 45. Virus Filtration Market in Mexico, 2018-2029, $ mn 80
Figure 46. European Virus Filtration Market, 2018-2029, $ mn 83
Figure 47. Breakdown of European Virus Filtration Market by Country, 2018 and 2029, % of Revenue 83
Figure 48. Contribution to Europe 2022-2029Cumulative Revenue by Country, Value ($ mn) and Share (%) 84
Figure 49. Virus Filtration Market in UK, 2018-2029, $ mn 85
Figure 50. Virus Filtration Market in France, 2018-2029, $ mn 87
Figure 51. Virus Filtration Market in Germany, 2018-2029, $ mn 89
Figure 52. Virus Filtration Market in Spain, 2018-2029, $ mn 91
Figure 53. Virus Filtration Market in Italy, 2018-2029, $ mn 93
Figure 54. Virus Filtration Market in Russia, 2018-2029, $ mn 95
Figure 55. Virus Filtration Market in Rest of Europe, 2018-2029, $ mn 97
Figure 56. Asia-Pacific Virus Filtration Market, 2018-2029, $ mn 100
Figure 57. Breakdown of APAC Virus Filtration Market by Country, 2018 and 2029, % of Revenue 100
Figure 58. Contribution to APAC 2022-2029Cumulative Revenue by Country, Value ($ mn) and Share (%) 101
Figure 59. Virus Filtration Market in China, 2018-2029, $ mn 102
Figure 60. Virus Filtration Market in Japan, 2018-2029, $ mn 105
Figure 61. Virus Filtration Market in India, 2018-2029, $ mn 107
Figure 62. Virus Filtration Market in Australia, 2018-2029, $ mn 109
Figure 63. Virus Filtration Market in South Korea, 2018-2029, $ mn 111
Figure 64. Virus Filtration Market in Rest of APAC, 2018-2029, $ mn 113
Figure 65. South America Virus Filtration Market, 2018-2029, $ mn 116
Figure 66. Breakdown of South America Virus Filtration Market by Country, 2018 and 2029, % of Revenue 116
Figure 67. Contribution to South America 2022-2029Cumulative Revenue by Country, Value ($ mn) and Share (%) 117
Figure 68. Virus Filtration Market in Argentina, 2018-2029, $ mn 118
Figure 69. Virus Filtration Market in Brazil, 2018-2029, $ mn 120
Figure 70. Virus Filtration Market in Columbia, 2018-2029, $ mn 122
Figure 71. Virus Filtration Market in Rest of South America, 2018-2029, $ mn 124
Figure 72. Virus Filtration Market in Middle East and Africa (MEA), 2018-2029, $ mn 126
Figure 73. Breakdown of MEA Virus Filtration Market by Country, 2018 and 2029, % of Revenue 126
Figure 74. Contribution to MEA 2022-2029 Cumulative Revenue by Country, Value ($ mn) and Share (%) 127
Figure 75. Virus Filtration Market in UAE, 2018-2029, $ mn 128
Figure 76. Virus Filtration Market in Saudi Arabia, 2018-2029, $ mn 130
Figure 77. Virus Filtration Market in South Africa, 2018-2029, $ mn 132
Figure 78. Growth Stage of Global Virus Filtration Industry over the Forecast Period 135
Global virus filtration market will reach $6,275.3 million by 2029, growing by 12.26% annually over 2018-2029 owing to rapid growth of the pharmaceutical and biotechnology industry, increasing investments in R&D, surging need for virus removal and clearance amid COVID-19 pandemic.
Highlighted with 84 tables and 78 figures, this 157-page report “Global Virus Filtration Market 2022-2029 by Product (Consumables, Instruments, Services), Application, End User, and Region: COVID-19 Impact and Growth Opportunity” is based on a holistic research of the entire global virus filtration market and all its sub-segments through extensively detailed classifications. Profound analysis and assessment are generated from premium primary and secondary information sources with inputs derived from industry professionals across the value chain. The report is based on studies on 2018-2021 and provides a forecast from 2022 to 2029 with 2021 as the base year. (Please note: The report will be updated before delivery so that the latest historical year is the base year and the forecast covers at least 5 years over the base year.)
In-depth qualitative analyses include identification and investigation of the following aspects:
• Market Structure
• Growth Drivers
• Restraints and Challenges
• Emerging Product Trends & Market Opportunities
• Porter’s Fiver Forces
The trend and outlook of global market is forecast in optimistic, balanced, and conservative view by taking into account of COVID-19. The balanced (most likely) projection is used to quantify global virus filtration market in every aspect of the classification from perspectives of Product, Application, End User, and Region.
Based on Product, the global market is segmented into the following sub-markets with annual revenue ($ mn) for 2018-2029 included in each section.
Consumables
Instruments
• Filtration Systems
• Chromatography systems
Services
Based on Application, the global market is segmented into the following sub-markets with annual revenue ($ mn) for 2018-2029 included in each section.
Biological Applications
• Vaccines and Therapeutics
• Blood and Blood Products
• Cellular and Gene Therapy Products
• Tissue and Tissue Products
• Stem Cell Products
Medical Devices
Water Purification
Air Purification
Other Applications
Based on End User, the global market is segmented into the following sub-markets with annual revenue ($ mn) for 2018-2029 included in each section.
• Pharmaceutical and Biotechnology Companies
• Contract Research Organisations (CROs)
• Academic & Research Institutes
• Medical Device Companies
• Other End Users
Geographically, the following regions together with the listed national/local markets are fully investigated:
• APAC (Japan, China, South Korea, Australia, India, and Rest of APAC; Rest of APAC is further segmented into Malaysia, Singapore, Indonesia, Thailand, New Zealand, Vietnam, and Sri Lanka)
• Europe (Germany, UK, France, Spain, Italy, Russia, Rest of Europe; Rest of Europe is further segmented into Belgium, Denmark, Austria, Norway, Sweden, The Netherlands, Poland, Czech Republic, Slovakia, Hungary, and Romania)
• North America (U.S., Canada, and Mexico)
• South America (Brazil, Columbia, Argentina, Rest of South America)
• MEA (Saudi Arabia, UAE, South Africa)
For each region and key country, detailed analysis and data for annual revenue ($ mn) are available for 2018-2029. The breakdown of all regional markets by country and split of key national markets by Product, Application, and End User over the forecast years are also included.
The report also covers current competitive scenario and the predicted trend; and profiles key vendors including market leaders and important emerging players.
Specifically, potential risks associated with investing in global virus filtration market are assayed quantitatively and qualitatively through GMD’s Risk Assessment System. According to the risk analysis and evaluation, Critical Success Factors (CSFs) are generated as a guidance to help investors & stockholders identify emerging opportunities, manage and minimize the risks, develop appropriate business models, and make wise strategies and decisions. Key Players (this may not be a complete list and extra companies can be added upon request):
Asahi Kasei Medical Co., Ltd.
Charles River Laboratories International, Inc.
Clean Cells
General Electric Company
Lonza Group AG
Merck KGaA
MilliporeSigma
Pall Corporation
Sartorius AG
Thermo Fisher Scientific, Inc.
Wuxi Apptec
(Please note: The report will be updated before delivery so that the latest historical year is the base year and the forecast covers at least 5 years over the base year.)
1 Introduction 8
1.1 Industry Definition and Research Scope 8
1.1.1 Industry Definition 8
1.1.2 Research Scope 9
1.2 Research Methodology 12
1.2.1 Overview of Market Research Methodology 12
1.2.2 Market Assumption 13
1.2.3 Secondary Data 13
1.2.4 Primary Data 13
1.2.5 Data Filtration and Model Design 15
1.2.6 Market Size/Share Estimation 16
1.2.7 Research Limitations 17
1.3 Executive Summary 18
2 Market Overview and Dynamics 20
2.1 Market Size and Forecast 20
2.1.1 Impact of COVID-19 on World Economy 21
2.1.2 Impact of COVID-19 on the Market 24
2.2 Major Growth Drivers 26
2.3 Market Restraints and Challenges 29
2.4 Emerging Opportunities and Market Trends 32
2.5 Porter’s Fiver Forces Analysis 36
3 Segmentation of Global Market by Product 40
3.1 Market Overview by Product 40
3.2 Consumables 42
3.3 Instruments 43
3.3.1 Filtration Systems 44
3.3.2 Chromatography systems 45
3.4 Services 46
4 Segmentation of Global Market by Application 47
4.1 Market Overview by Application 47
4.2 Biological Applications 49
4.2.1 Vaccines and Therapeutics 51
4.2.2 Blood and Blood Products 52
4.2.3 Cellular and Gene Therapy Products 53
4.2.4 Tissue and Tissue Products 54
4.2.5 Stem Cell Products 55
4.3 Medical Devices 56
4.4 Water Purification 57
4.5 Air Purification 58
4.6 Other Applications 59
5 Segmentation of Global Market by End User 60
5.1 Market Overview by End User 60
5.2 Pharmaceutical and Biotechnology Companies 62
5.3 Contract Research Organisations (CROs) 63
5.4 Academic & Research Institutes 64
5.5 Medical Device Companies 65
5.6 Other End Users 66
6 Segmentation of Global Market by Region 67
6.1 Geographic Market Overview 2019-2026 67
6.2 North America Market 2019-2026 by Country 71
6.2.1 Overview of North America Market 71
6.2.2 U.S. 74
6.2.3 Canada 78
6.2.4 Mexico 80
6.3 European Market 2019-2026 by Country 82
6.3.1 Overview of European Market 82
6.3.2 UK 85
6.3.3 France 87
6.3.4 Germany 89
6.3.5 Spain 91
6.3.6 Italy 93
6.3.7 Russia 95
6.3.8 Rest of European Market 97
6.4 Asia-Pacific Market 2018-2029 by Country 99
6.4.1 Overview of Asia-Pacific Market 99
6.4.2 China 102
6.4.3 Japan 104
6.4.4 India 107
6.4.5 Australia 109
6.4.6 South Korea 111
6.4.7 Rest of APAC Region 113
6.5 South America Market 2018-2029 by Country 115
6.5.1 Argentina 118
6.5.2 Brazil 120
6.5.3 Columbia 122
6.5.4 Rest of South America Market 124
6.6 MEA Market 2018-2029 by Country 125
6.6.1 UAE 128
6.6.2 Saudi Arabia 130
6.6.3 South Africa 132
6.6.4 Other National Markets 134
7 Competitive Landscape 135
7.1 Overview of Key Vendors 135
7.2 New Product Launch, Partnership, Investment, and M&A 138
7.3 Company Profiles 139
Asahi Kasei Medical Co., Ltd. 139
Charles River Laboratories International, Inc. 141
Clean Cells 142
General Electric Company 143
Lonza Group AG 144
Merck KGaA 145
MilliporeSigma 146
Pall Corporation 147
Sartorius AG 148
Thermo Fisher Scientific, Inc. 149
Wuxi Apptec 150
8 Investing in Global Market: Risk Assessment and Management 151
8.1 Risk Evaluation of Global Market 151
8.2 Critical Success Factors (CSFs) 154
Related Reports and Products 157
Key Players (this may not be a complete list and extra companies can be added upon request):
Asahi Kasei Medical Co., Ltd.
Charles River Laboratories International, Inc.
Clean Cells
General Electric Company
Lonza Group AG
Merck KGaA
MilliporeSigma
Pall Corporation
Sartorius AG
Thermo Fisher Scientific, Inc.
Wuxi Apptec
Table 1. Snapshot of Global Virus Filtration Market in Balanced Perspective, 2018-2029 19
Table 2. Growth Rate of World Real GDP, 2017-2021 22
Table 3. Main Product Trends and Market Opportunities in Global Virus Filtration Market 32
Table 4. Global Virus Filtration Market by Product, 2018-2029, $ mn 40
Table 5. Global Virus Filtration Market: Instruments by Technology, 2018-2029, $ mn 43
Table 6. Global Virus Filtration Market by Application, 2018-2029, $ mn 47
Table 7. Global Virus Filtration Market: Biological Applications by Segment, 2018-2029, $ mn 50
Table 8. Global Virus Filtration Market by End User, 2018-2029, $ mn 60
Table 9. Global Virus Filtration Market by Region, 2018-2029, $ mn 68
Table 10. Leading National Virus Filtration Market, 2018 and 2029, $ mn 70
Table 11. North America Virus Filtration Market by Country, 2018-2029, $ mn 73
Table 12. U.S. Virus Filtration Market by Product, 2018-2029, $ mn 76
Table 13. U.S. Virus Filtration Market by Application, 2018-2029, $ mn 76
Table 14. U.S. Virus Filtration Market by End User, 2018-2029, $ mn 76
Table 15. Canada Virus Filtration Market by Product, 2018-2029, $ mn 79
Table 16. Canada Virus Filtration Market by Application, 2018-2029, $ mn 79
Table 17. Canada Virus Filtration Market by End User, 2018-2029, $ mn 79
Table 18. Mexico Virus Filtration Market by Product, 2018-2029, $ mn 81
Table 19. Mexico Virus Filtration Market by Application, 2018-2029, $ mn 81
Table 20. Mexico Virus Filtration Market by End User, 2018-2029, $ mn 81
Table 21. Europe Virus Filtration Market by Country, 2018-2029, $ mn 84
Table 22. UK Virus Filtration Market by Product, 2018-2029, $ mn 86
Table 23. UK Virus Filtration Market by Application, 2018-2029, $ mn 86
Table 24. UK Virus Filtration Market by End User, 2018-2029, $ mn 86
Table 25. France Virus Filtration Market by Product, 2018-2029, $ mn 88
Table 26. France Virus Filtration Market by Application, 2018-2029, $ mn 88
Table 27. France Virus Filtration Market by End User, 2018-2029, $ mn 88
Table 28. Germany Virus Filtration Market by Product, 2018-2029, $ mn 90
Table 29. Germany Virus Filtration Market by Application, 2018-2029, $ mn 90
Table 30. Germany Virus Filtration Market by End User, 2018-2029, $ mn 90
Table 31. Spain Virus Filtration Market by Product, 2018-2029, $ mn 92
Table 32. Spain Virus Filtration Market by Application, 2018-2029, $ mn 92
Table 33. Spain Virus Filtration Market by End User, 2018-2029, $ mn 92
Table 34. Italy Virus Filtration Market by Product, 2018-2029, $ mn 94
Table 35. Italy Virus Filtration Market by Application, 2018-2029, $ mn 94
Table 36. Italy Virus Filtration Market by End User, 2018-2029, $ mn 94
Table 37. Russia Virus Filtration Market by Product, 2018-2029, $ mn 96
Table 38. Russia Virus Filtration Market by Application, 2018-2029, $ mn 96
Table 39. Russia Virus Filtration Market by End User, 2018-2029, $ mn 96
Table 40. Virus Filtration Market in Rest of Europe by Country, 2018-2029, $ mn 98
Table 41. APAC Virus Filtration Market by Country, 2018-2029, $ mn 101
Table 42. China Virus Filtration Market by Product, 2018-2029, $ mn 103
Table 43. China Virus Filtration Market by Application, 2018-2029, $ mn 103
Table 44. China Virus Filtration Market by End User, 2018-2029, $ mn 103
Table 45. Japan Virus Filtration Market by Product, 2018-2029, $ mn 106
Table 46. Japan Virus Filtration Market by Application, 2018-2029, $ mn 106
Table 47. Japan Virus Filtration Market by End User, 2018-2029, $ mn 106
Table 48. India Virus Filtration Market by Product, 2018-2029, $ mn 108
Table 49. India Virus Filtration Market by Application, 2018-2029, $ mn 108
Table 50. India Virus Filtration Market by End User, 2018-2029, $ mn 108
Table 51. Australia Virus Filtration Market by Product, 2018-2029, $ mn 110
Table 52. Australia Virus Filtration Market by Application, 2018-2029, $ mn 110
Table 53. Australia Virus Filtration Market by End User, 2018-2029, $ mn 110
Table 54. South Korea Virus Filtration Market by Product, 2018-2029, $ mn 112
Table 55. South Korea Virus Filtration Market by Application, 2018-2029, $ mn 112
Table 56. South Korea Virus Filtration Market by End User, 2018-2029, $ mn 112
Table 57. Virus Filtration Market in Rest of APAC by Country, 2018-2029, $ mn 114
Table 58. South America Virus Filtration Market by Country, 2018-2029, $ mn 117
Table 59. Argentina Virus Filtration Market by Product, 2018-2029, $ mn 119
Table 60. Argentina Virus Filtration Market by Application, 2018-2029, $ mn 119
Table 61. Argentina Virus Filtration Market by End User, 2018-2029, $ mn 119
Table 62. Brazil Virus Filtration Market by Product, 2018-2029, $ mn 121
Table 63. Brazil Virus Filtration Market by Application, 2018-2029, $ mn 121
Table 64. Brazil Virus Filtration Market by End User, 2018-2029, $ mn 121
Table 65. Columbia Virus Filtration Market by Product, 2018-2029, $ mn 123
Table 66. Columbia Virus Filtration Market by Application, 2018-2029, $ mn 123
Table 67. Columbia Virus Filtration Market by End User, 2018-2029, $ mn 123
Table 68. MEA Virus Filtration Market by Country, 2018-2029, $ mn 127
Table 69. UAE Virus Filtration Market by Product, 2018-2029, $ mn 129
Table 70. UAE Virus Filtration Market by Application, 2018-2029, $ mn 129
Table 71. UAE Virus Filtration Market by End User, 2018-2029, $ mn 129
Table 72. Saudi Arabia Virus Filtration Market by Product, 2018-2029, $ mn 131
Table 73. Saudi Arabia Virus Filtration Market by Application, 2018-2029, $ mn 131
Table 74. Saudi Arabia Virus Filtration Market by End User, 2018-2029, $ mn 131
Table 75. South Africa Virus Filtration Market by Product, 2018-2029, $ mn 133
Table 76. South Africa Virus Filtration Market by Application, 2018-2029, $ mn 133
Table 77. South Africa Virus Filtration Market by End User, 2018-2029, $ mn 133
Table 78. Asahi Kasei Medical Co., Ltd.: Company Snapshot 139
Table 79. Asahi Kasei Medical Co., Ltd.: Business Segmentation 139
Table 80. Asahi Kasei Medical Co., Ltd.: Product Portfolio 140
Table 81. Asahi Kasei Medical Co., Ltd.: Revenue, 2016-2018, $ mn 140
Table 82. Asahi Kasei Medical Co., Ltd.: Recent Developments 140
Table 83. Risk Evaluation for Investing in Global Market, 2018-2029 152
Table 84. Critical Success Factors and Key Takeaways 155
Figure 1. Research Method Flow Chart 12
Figure 2. Breakdown of Primary Research 14
Figure 3. Bottom-up Approach and Top-down Approach for Market Estimation 16
Figure 4. Global Market Forecast in Optimistic, Conservative and Balanced Perspectives, 2018-2029 18
Figure 5. Global Virus Filtration Market, 2018-2029, $ mn 20
Figure 6. Impact of COVID-19 on Business 24
Figure 7. Primary Drivers and Impact Factors of Global Virus Filtration Market 26
Figure 8. Primary Restraints and Impact Factors of Global Virus Filtration Market 29
Figure 9. Investment Opportunity Analysis 33
Figure 10. Porter’s Fiver Forces Analysis of Global Virus Filtration Market 36
Figure 11. Breakdown of Global Virus Filtration Market by Product, 2018-2029, % of Revenue 40
Figure 12. Contribution to Global 2022-2029Cumulative Revenue by Product, Value ($ mn) and Share (%) 41
Figure 13. Global Virus Filtration Market: Consumables, 2018-2029, $ mn 42
Figure 14. Global Virus Filtration Market: Instruments, 2018-2029, $ mn 43
Figure 15. Global Virus Filtration Market: Filtration Systems, 2018-2029, $ mn 44
Figure 16. Global Virus Filtration Market: Chromatography systems, 2018-2029, $ mn 45
Figure 17. Global Virus Filtration Market: Services, 2018-2029, $ mn 46
Figure 18. Breakdown of Global Virus Filtration Market by Application, 2018-2029, % of Revenue 47
Figure 19. Contribution to Global 2022-2029Cumulative Revenue by Application, Value ($ mn) and Share (%) 48
Figure 20. Global Virus Filtration Market: Biological Applications, 2018-2029, $ mn 49
Figure 21. Global Virus Filtration Market: Vaccines and Therapeutics, 2018-2029, $ mn 51
Figure 22. Global Virus Filtration Market: Blood and Blood Products, 2018-2029, $ mn 52
Figure 23. Global Virus Filtration Market: Cellular and Gene Therapy Products, 2018-2029, $ mn 53
Figure 24. Global Virus Filtration Market: Tissue and Tissue Products, 2018-2029, $ mn 54
Figure 25. Global Virus Filtration Market: Stem Cell Products, 2018-2029, $ mn 55
Figure 26. Global Virus Filtration Market: Medical Devices, 2018-2029, $ mn 56
Figure 27. Global Virus Filtration Market: Water Purification, 2018-2029, $ mn 57
Figure 28. Global Virus Filtration Market: Air Purification, 2018-2029, $ mn 58
Figure 29. Global Virus Filtration Market: Other Applications, 2018-2029, $ mn 59
Figure 30. Breakdown of Global Virus Filtration Market by End User, 2018-2029, % of Revenue 61
Figure 31. Contribution to Global 2022-2029Cumulative Revenue by End User, Value ($ mn) and Share (%) 61
Figure 32. Global Virus Filtration Market: Pharmaceutical and Biotechnology Companies, 2018-2029, $ mn 62
Figure 33. Global Virus Filtration Market: Contract Research Organisations (CROs), 2018-2029, $ mn 63
Figure 34. Global Virus Filtration Market: Academic & Research Institutes, 2018-2029, $ mn 64
Figure 35. Global Virus Filtration Market: Medical Device Companies, 2018-2029, $ mn 65
Figure 36. Global Virus Filtration Market: Other End Users, 2018-2029, $ mn 66
Figure 37. Global Market Snapshot by Region 67
Figure 38. Geographic Spread of Worldwide Virus Filtration Market, 2018-2029, % of Revenue 68
Figure 39. Contribution to Global 2022-2029Cumulative Revenue by Region, Value ($ mn) and Share (%) 69
Figure 40. North American Virus Filtration Market, 2018-2029, $ mn 72
Figure 41. Breakdown of North America Virus Filtration Market by Country, 2018 and 2029, % of Revenue 72
Figure 42. Contribution to North America 2022-2029Cumulative Revenue by Country, Value ($ mn) and Share (%) 73
Figure 43. U.S. Virus Filtration Market, 2018-2029, $ mn 75
Figure 44. Canada Virus Filtration Market, 2018-2029, $ mn 78
Figure 45. Virus Filtration Market in Mexico, 2018-2029, $ mn 80
Figure 46. European Virus Filtration Market, 2018-2029, $ mn 83
Figure 47. Breakdown of European Virus Filtration Market by Country, 2018 and 2029, % of Revenue 83
Figure 48. Contribution to Europe 2022-2029Cumulative Revenue by Country, Value ($ mn) and Share (%) 84
Figure 49. Virus Filtration Market in UK, 2018-2029, $ mn 85
Figure 50. Virus Filtration Market in France, 2018-2029, $ mn 87
Figure 51. Virus Filtration Market in Germany, 2018-2029, $ mn 89
Figure 52. Virus Filtration Market in Spain, 2018-2029, $ mn 91
Figure 53. Virus Filtration Market in Italy, 2018-2029, $ mn 93
Figure 54. Virus Filtration Market in Russia, 2018-2029, $ mn 95
Figure 55. Virus Filtration Market in Rest of Europe, 2018-2029, $ mn 97
Figure 56. Asia-Pacific Virus Filtration Market, 2018-2029, $ mn 100
Figure 57. Breakdown of APAC Virus Filtration Market by Country, 2018 and 2029, % of Revenue 100
Figure 58. Contribution to APAC 2022-2029Cumulative Revenue by Country, Value ($ mn) and Share (%) 101
Figure 59. Virus Filtration Market in China, 2018-2029, $ mn 102
Figure 60. Virus Filtration Market in Japan, 2018-2029, $ mn 105
Figure 61. Virus Filtration Market in India, 2018-2029, $ mn 107
Figure 62. Virus Filtration Market in Australia, 2018-2029, $ mn 109
Figure 63. Virus Filtration Market in South Korea, 2018-2029, $ mn 111
Figure 64. Virus Filtration Market in Rest of APAC, 2018-2029, $ mn 113
Figure 65. South America Virus Filtration Market, 2018-2029, $ mn 116
Figure 66. Breakdown of South America Virus Filtration Market by Country, 2018 and 2029, % of Revenue 116
Figure 67. Contribution to South America 2022-2029Cumulative Revenue by Country, Value ($ mn) and Share (%) 117
Figure 68. Virus Filtration Market in Argentina, 2018-2029, $ mn 118
Figure 69. Virus Filtration Market in Brazil, 2018-2029, $ mn 120
Figure 70. Virus Filtration Market in Columbia, 2018-2029, $ mn 122
Figure 71. Virus Filtration Market in Rest of South America, 2018-2029, $ mn 124
Figure 72. Virus Filtration Market in Middle East and Africa (MEA), 2018-2029, $ mn 126
Figure 73. Breakdown of MEA Virus Filtration Market by Country, 2018 and 2029, % of Revenue 126
Figure 74. Contribution to MEA 2022-2029 Cumulative Revenue by Country, Value ($ mn) and Share (%) 127
Figure 75. Virus Filtration Market in UAE, 2018-2029, $ mn 128
Figure 76. Virus Filtration Market in Saudi Arabia, 2018-2029, $ mn 130
Figure 77. Virus Filtration Market in South Africa, 2018-2029, $ mn 132
Figure 78. Growth Stage of Global Virus Filtration Industry over the Forecast Period 135
Frequently Asked Questions About This Report
Choose License Type
Each market study on Reports Globe will be revised based on COVID-19 impact analysis
How can we help you?
Our salient features
Best Solution
We will help you understand value propositions of various reports across numerous domains and suggest the best possible solution to suffice your research needs.
Customized Research
Our team of analysts and consultants provide assistance for customized research requirements
Max ROI
Guaranteed maximum assistance to help you get your reports at the optimum prices, thereby ensuring maximum returns on investment.
24/7 Support
24X7 availability to help you through the buying process as well as answer any of your doubts.