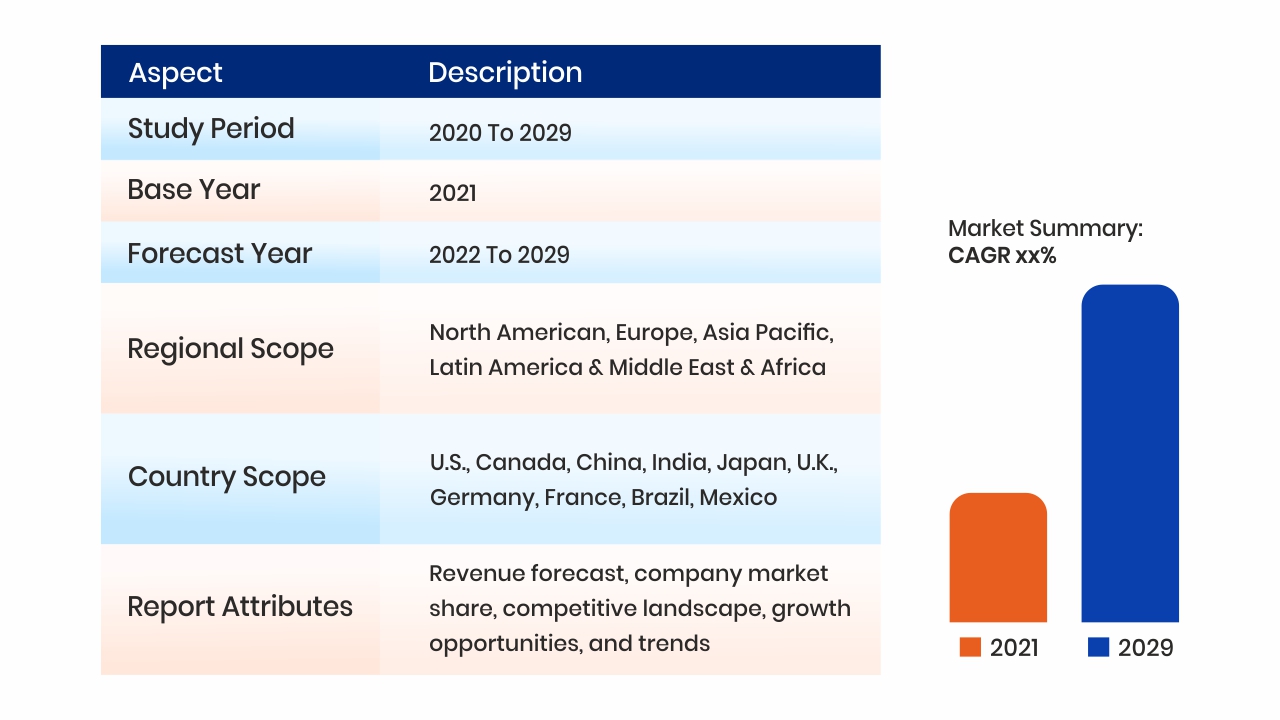
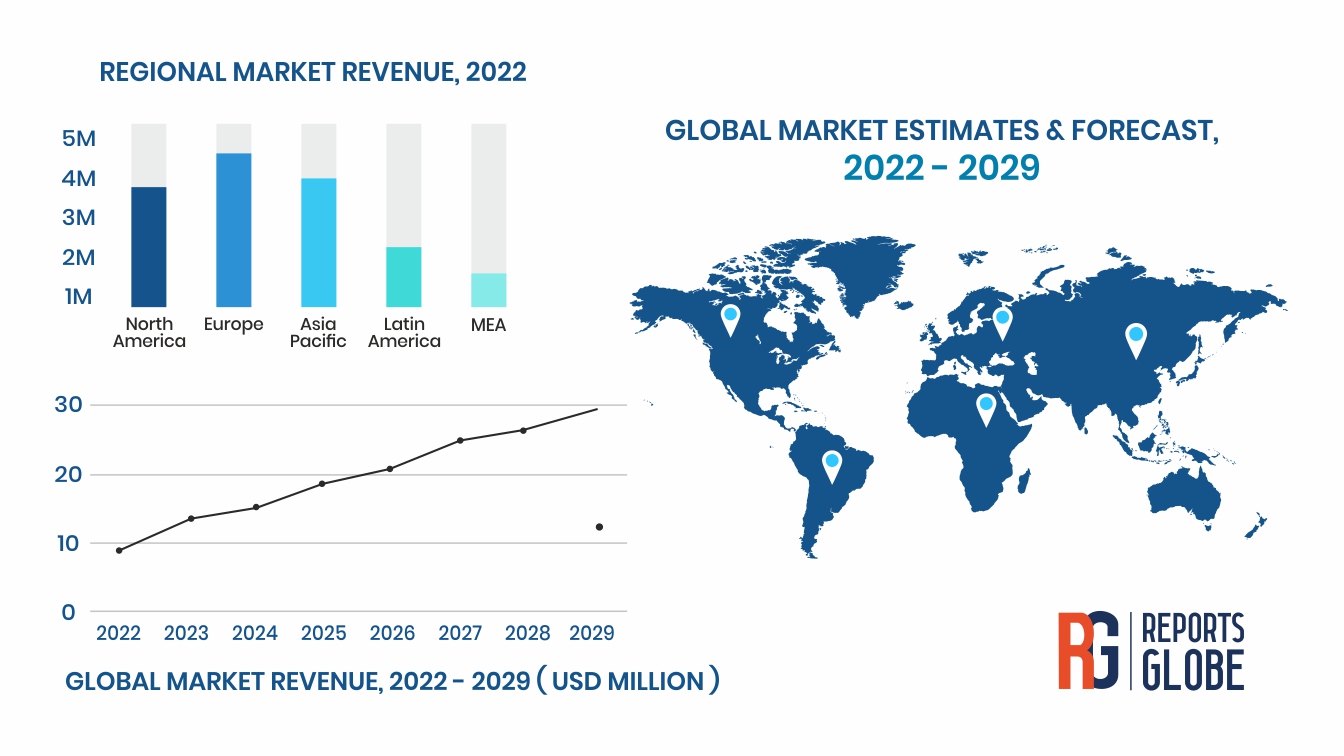
Europe oilfield equipment market garnered a revenue of USD 16.15 billion in the year 2021 globally and has been foreseen to yield USD 19.99 billion by the year 2029 at a compound annual growth (CAGR) of 3.7% over the forecast period. The market has been observed to be growing at a steady growth rate over the last three years, however with the impact of COVID-19 pandemic globally, the business conditions are expected to change. The market size may reduce significantly or increase with a spike depending on how the value chain has been affected in the entire process.
Players that are operational in the market for a longer period of time are anticipated to absorb the sudden changes, losses and increased operational costs better than those who have recently entered the market. The report focuses on numerous factors that are anticipated to impact the market growth directly and indirectly. The report categorically analyses the growth patterns of different segments based on multiple derivation models.
Both the qualitative and quantitative aspects have been covered under the report. The Europe oilfield equipment market report includes market size, drivers, restraints, opportunities and trends that will help you understand the market dynamics in detail. Moreover, the report will include market estimates & forecasts in terms of revenue for the overall market along with the segments mentioned in the study. The report focuses on providing a holistic view of the entire market scenario from multiple unmatched detailed analysis mentioned in the report.
What to expect from the report?
Europe Oilfield Equipment Total Available Market (TAM) Size
Europe Oilfield Equipment Serviceable Available Market (SAM) Size
Business Implications of COVID-19 on the Overall Market
Market Share/ Revenue Share (%) of Top Market Players in Total Market Size (2021)
Market Size & Forecast (2022-2029) At Country & Regional Level, By Segments
Overview & Analysis of Key Players Operating in the Market
Global market revenue in 2021 will be derived taking into various micro & macro level factors; along with the COVID-19 pandemic
Competitive Analysis
Company Market Share Analysis, 2021 (%)
Supply Chain Analysis
Analysis pertaining to several participants of the supply chain such as raw material suppliers, distributors, & OEMs along with others will be highlighted in the study
Data Source
Primary & Secondary Research, Internal Data Base & Company Annual Reports
Regions Included
Europe
Countries Included
U.K., Others
Table of Contents
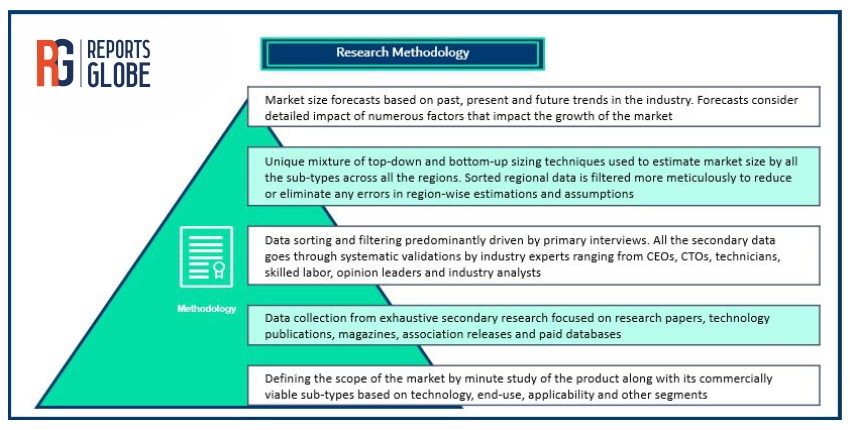
Chapter 1. Research Methodology & Data Sources
1.1. Data Analysis Models
1.2. Research Scope & Assumptions
1.3. List of Primary & Secondary Data Sources
Chapter 2. Executive Summary
Chapter 3. Europe Oilfield Equipment Market: Industry Analysis
3.1. Market segmentation
3.2. Supply chain analysis
3.3. Porter’s 5 forces analysis
3.4. PEST analysis
3.5. Market Dynamics
3.5.1. Market driver analysis
3.5.2. Market restraint analysis
3.5.3. Market opportunity analysis
3.6. Company Market Share Analysis, 2021
Chapter 4. Europe Oilfield Equipment Market: Product Insights
4.1. Global Product Historic Market Data & Future Forecasts, 2018-2029
4.2. Drilling equipment
4.2.1. Historic Market Data & Future Forecasts, 2018-2029
4.2.2. Historic Market Data & Future Forecasts by Region, 2018-2029
4.3. Pumps & valves
4.3.1. Historic Market Data & Future Forecasts, 2018-2029
4.3.2. Historic Market Data & Future Forecasts by Region, 2018-2029
4.4. Field production machinery
4.4.1. Historic Market Data & Future Forecasts, 2018-2029
4.4.2. Historic Market Data & Future Forecasts by Region, 2018-2029
Chapter 5. Europe Oilfield Equipment Market: Regional Insights
5.1. Global Europe Oilfield Equipment Market Data & Future Forecasts, By Region 2018-2029
5.2. Europe
5.2.1. Historic Market Data & Future Forecasts, 2018-2029
5.2.2. Historic Market Data & Future Forecasts, By Product , 2018-2029
5.2.3. U.K.
5.2.3.1. Historic Market Data & Future Forecasts, 2018-2029
5.2.3.2. Historic Market Data & Future Forecasts, By Product , 2018-2029
5.2.4. Others
5.2.4.1. Historic Market Data & Future Forecasts, 2018-2029
5.2.4.2. Historic Market Data & Future Forecasts, By Product , 2018-2029
Chapter 6. Company Profiles
6.1. ENI
6.1.1. Company Description
6.1.2. Financial Highlights
6.1.3. Product Portfolio
6.1.4. Strategic Initiatives
6.2. PSR Oilfield Equipment Ltd.
6.2.1. Company Description
6.2.2. Financial Highlights
6.2.3. Product Portfolio
6.2.4. Strategic Initiatives
6.3. Tenaris SA
6.3.1. Company Description
6.3.2. Financial Highlights
6.3.3. Product Portfolio
6.3.4. Strategic Initiatives
6.4. Technip SA
6.4.1. Company Description
6.4.2. Financial Highlights
6.4.3. Product Portfolio
6.4.4. Strategic Initiatives
6.5. Sulzer Limited
6.5.1. Company Description
6.5.2. Financial Highlights
6.5.3. Product Portfolio
6.5.4. Strategic Initiatives
6.6. Vallourec
6.6.1. Company Description
6.6.2. Financial Highlights
6.6.3. Product Portfolio
6.6.4. Strategic Initiatives
6.7. Sandvik AB
6.7.1. Company Description
6.7.2. Financial Highlights
6.7.3. Product Portfolio
6.7.4. Strategic Initiatives
6.8. KSB AG
6.8.1. Company Description
6.8.2. Financial Highlights
6.8.3. Product Portfolio
6.8.4. Strategic Initiatives
6.9. Foster Wheeler AG
6.9.1. Company Description
6.9.2. Financial Highlights
6.9.3. Product Portfolio
6.9.4. Strategic Initiatives
6.10. Schoeller-Bleckmann Oilfield Technology GmbH
6.10.1. Company Description
6.10.2. Financial Highlights
6.10.3. Product Portfolio
6.10.4. Strategic Initiatives
6.11. Atlas Copco
6.11.1. Company Description
6.11.2. Financial Highlights
6.11.3. Product Portfolio
6.11.4. Strategic Initiatives
6.12. SBS Oilfield Equipment GmbH
6.12.1. Company Description
6.12.2. Financial Highlights
6.12.3. Product Portfolio
6.12.4. Strategic Initiatives
6.13. Transocean
6.13.1. Company Description
6.13.2. Financial Highlights
6.13.3. Product Portfolio
6.13.4. Strategic Initiatives
6.14. Zenith Oilfield Technology
6.14.1. Company Description
6.14.2. Financial Highlights
6.14.3. Product Portfolio
6.14.4. Strategic Initiatives
6.15. Aker Solutions
6.15.1. Company Description
6.15.2. Financial Highlights
6.15.3. Product Portfolio
6.15.4. Strategic Initiatives
List of Tables
Table 1 Europe Oilfield Equipment Market Market Data & Future Forecasts, 2018-2029 (USD Million)
Table 2 Europe Oilfield Equipment Market Data & Future Forecasts, By Region, 2018-2029 (USD Million)
Table 3 Europe Oilfield Equipment Market Data & Future Forecasts, By Product , 2018-2029 (USD Million)
Table 4 Drilling equipment Market Data & Future Forecasts, 2018-2029 (USD Million)
Table 5 Pumps & valves Market Data & Future Forecasts, 2018-2029 (USD Million)
Table 6 Field production machinery Market Data & Future Forecasts, 2018-2029 (USD Million)
Table 7 U.K. Europe Oilfield Equipment Market Data & Future Forecasts, 2018-2029 (USD Million)
Table 8 U.K Europe Oilfield Equipment Market Data & Future Forecasts, By Product , 2018-2029 (USD Million)
Table 9 Others Europe Oilfield Equipment Market Data & Future Forecasts, 2018-2029 (USD Million)
Table 10 Others Europe Oilfield Equipment Market Data & Future Forecasts, By Product , 2018-2029 (USD Million)
List of Figures
Fig.1 Data Analysis Model
Fig.2 Europe Oilfield Equipment Market, by 2018-2029 (USD Million)
Fig.3 Europe Oilfield Equipment Market Segmentation
Fig.4 Supply chain analysis
Fig.5 Europe Oilfield Equipment Market Driver Anlaysis
Fig.6 Europe Oilfield Equipment Market Restraint Analysis
Fig.7 Europe Oilfield Equipment Market Opportunity Analysis
Fig.8 Porters 5 Forces Model
Fig.9 PEST Analysis- Europe Oilfield Equipment Market
Fig.10 Company Market Share Analysis, 2021
Europe Oilfield Equipment Market Segmentation:
Europe Oilfield Equipment Market, By Product (2018-2029)
Drilling equipment
Pumps & valves
Field production machinery
Europe Oilfield Equipment Market, By Region (2018-2029)
Europe
U.K.
Others
Major Players Operating in the Europe Oilfield Equipment Market:
Europe oilfield equipment market garnered a revenue of USD 16.15 billion in the year 2021 globally and has been foreseen to yield USD 19.99 billion by the year 2029 at a compound annual growth (CAGR) of 3.7% over the forecast period. The market has been observed to be growing at a steady growth rate over the last three years, however with the impact of COVID-19 pandemic globally, the business conditions are expected to change. The market size may reduce significantly or increase with a spike depending on how the value chain has been affected in the entire process.
Players that are operational in the market for a longer period of time are anticipated to absorb the sudden changes, losses and increased operational costs better than those who have recently entered the market. The report focuses on numerous factors that are anticipated to impact the market growth directly and indirectly. The report categorically analyses the growth patterns of different segments based on multiple derivation models.
Both the qualitative and quantitative aspects have been covered under the report. The Europe oilfield equipment market report includes market size, drivers, restraints, opportunities and trends that will help you understand the market dynamics in detail. Moreover, the report will include market estimates & forecasts in terms of revenue for the overall market along with the segments mentioned in the study. The report focuses on providing a holistic view of the entire market scenario from multiple unmatched detailed analysis mentioned in the report.
What to expect from the report?
Europe Oilfield Equipment Total Available Market (TAM) Size
Europe Oilfield Equipment Serviceable Available Market (SAM) Size
Business Implications of COVID-19 on the Overall Market
Market Share/ Revenue Share (%) of Top Market Players in Total Market Size (2021)
Market Size & Forecast (2022-2029) At Country & Regional Level, By Segments
Overview & Analysis of Key Players Operating in the Market
Global market revenue in 2021 will be derived taking into various micro & macro level factors; along with the COVID-19 pandemic
Competitive Analysis
Company Market Share Analysis, 2021 (%)
Supply Chain Analysis
Analysis pertaining to several participants of the supply chain such as raw material suppliers, distributors, & OEMs along with others will be highlighted in the study
Data Source
Primary & Secondary Research, Internal Data Base & Company Annual Reports
Regions Included
Europe
Countries Included
U.K., Others
Table of Contents
Chapter 1. Research Methodology & Data Sources
1.1. Data Analysis Models
1.2. Research Scope & Assumptions
1.3. List of Primary & Secondary Data Sources
Chapter 2. Executive Summary
Chapter 3. Europe Oilfield Equipment Market: Industry Analysis
3.1. Market segmentation
3.2. Supply chain analysis
3.3. Porter’s 5 forces analysis
3.4. PEST analysis
3.5. Market Dynamics
3.5.1. Market driver analysis
3.5.2. Market restraint analysis
3.5.3. Market opportunity analysis
3.6. Company Market Share Analysis, 2021
Chapter 4. Europe Oilfield Equipment Market: Product Insights
4.1. Global Product Historic Market Data & Future Forecasts, 2018-2029
4.2. Drilling equipment
4.2.1. Historic Market Data & Future Forecasts, 2018-2029
4.2.2. Historic Market Data & Future Forecasts by Region, 2018-2029
4.3. Pumps & valves
4.3.1. Historic Market Data & Future Forecasts, 2018-2029
4.3.2. Historic Market Data & Future Forecasts by Region, 2018-2029
4.4. Field production machinery
4.4.1. Historic Market Data & Future Forecasts, 2018-2029
4.4.2. Historic Market Data & Future Forecasts by Region, 2018-2029
Chapter 5. Europe Oilfield Equipment Market: Regional Insights
5.1. Global Europe Oilfield Equipment Market Data & Future Forecasts, By Region 2018-2029
5.2. Europe
5.2.1. Historic Market Data & Future Forecasts, 2018-2029
5.2.2. Historic Market Data & Future Forecasts, By Product , 2018-2029
5.2.3. U.K.
5.2.3.1. Historic Market Data & Future Forecasts, 2018-2029
5.2.3.2. Historic Market Data & Future Forecasts, By Product , 2018-2029
5.2.4. Others
5.2.4.1. Historic Market Data & Future Forecasts, 2018-2029
5.2.4.2. Historic Market Data & Future Forecasts, By Product , 2018-2029
Chapter 6. Company Profiles
6.1. ENI
6.1.1. Company Description
6.1.2. Financial Highlights
6.1.3. Product Portfolio
6.1.4. Strategic Initiatives
6.2. PSR Oilfield Equipment Ltd.
6.2.1. Company Description
6.2.2. Financial Highlights
6.2.3. Product Portfolio
6.2.4. Strategic Initiatives
6.3. Tenaris SA
6.3.1. Company Description
6.3.2. Financial Highlights
6.3.3. Product Portfolio
6.3.4. Strategic Initiatives
6.4. Technip SA
6.4.1. Company Description
6.4.2. Financial Highlights
6.4.3. Product Portfolio
6.4.4. Strategic Initiatives
6.5. Sulzer Limited
6.5.1. Company Description
6.5.2. Financial Highlights
6.5.3. Product Portfolio
6.5.4. Strategic Initiatives
6.6. Vallourec
6.6.1. Company Description
6.6.2. Financial Highlights
6.6.3. Product Portfolio
6.6.4. Strategic Initiatives
6.7. Sandvik AB
6.7.1. Company Description
6.7.2. Financial Highlights
6.7.3. Product Portfolio
6.7.4. Strategic Initiatives
6.8. KSB AG
6.8.1. Company Description
6.8.2. Financial Highlights
6.8.3. Product Portfolio
6.8.4. Strategic Initiatives
6.9. Foster Wheeler AG
6.9.1. Company Description
6.9.2. Financial Highlights
6.9.3. Product Portfolio
6.9.4. Strategic Initiatives
6.10. Schoeller-Bleckmann Oilfield Technology GmbH
6.10.1. Company Description
6.10.2. Financial Highlights
6.10.3. Product Portfolio
6.10.4. Strategic Initiatives
6.11. Atlas Copco
6.11.1. Company Description
6.11.2. Financial Highlights
6.11.3. Product Portfolio
6.11.4. Strategic Initiatives
6.12. SBS Oilfield Equipment GmbH
6.12.1. Company Description
6.12.2. Financial Highlights
6.12.3. Product Portfolio
6.12.4. Strategic Initiatives
6.13. Transocean
6.13.1. Company Description
6.13.2. Financial Highlights
6.13.3. Product Portfolio
6.13.4. Strategic Initiatives
6.14. Zenith Oilfield Technology
6.14.1. Company Description
6.14.2. Financial Highlights
6.14.3. Product Portfolio
6.14.4. Strategic Initiatives
6.15. Aker Solutions
6.15.1. Company Description
6.15.2. Financial Highlights
6.15.3. Product Portfolio
6.15.4. Strategic Initiatives
List of Tables
Table 1 Europe Oilfield Equipment Market Market Data & Future Forecasts, 2018-2029 (USD Million)
Table 2 Europe Oilfield Equipment Market Data & Future Forecasts, By Region, 2018-2029 (USD Million)
Table 3 Europe Oilfield Equipment Market Data & Future Forecasts, By Product , 2018-2029 (USD Million)
Table 4 Drilling equipment Market Data & Future Forecasts, 2018-2029 (USD Million)
Table 5 Pumps & valves Market Data & Future Forecasts, 2018-2029 (USD Million)
Table 6 Field production machinery Market Data & Future Forecasts, 2018-2029 (USD Million)
Table 7 U.K. Europe Oilfield Equipment Market Data & Future Forecasts, 2018-2029 (USD Million)
Table 8 U.K Europe Oilfield Equipment Market Data & Future Forecasts, By Product , 2018-2029 (USD Million)
Table 9 Others Europe Oilfield Equipment Market Data & Future Forecasts, 2018-2029 (USD Million)
Table 10 Others Europe Oilfield Equipment Market Data & Future Forecasts, By Product , 2018-2029 (USD Million)
List of Figures
Fig.1 Data Analysis Model
Fig.2 Europe Oilfield Equipment Market, by 2018-2029 (USD Million)
Fig.3 Europe Oilfield Equipment Market Segmentation
Fig.4 Supply chain analysis
Fig.5 Europe Oilfield Equipment Market Driver Anlaysis
Fig.6 Europe Oilfield Equipment Market Restraint Analysis
Fig.7 Europe Oilfield Equipment Market Opportunity Analysis
Fig.8 Porters 5 Forces Model
Fig.9 PEST Analysis- Europe Oilfield Equipment Market
Fig.10 Company Market Share Analysis, 2021
Europe Oilfield Equipment Market Segmentation:
Europe Oilfield Equipment Market, By Product (2018-2029)
Drilling equipment
Pumps & valves
Field production machinery
Europe Oilfield Equipment Market, By Region (2018-2029)
Europe
U.K.
Others
Major Players Operating in the Europe Oilfield Equipment Market:
ENI
PSR Oilfield Equipment Ltd.
Tenaris SA
Technip SA
Sulzer Limited
Vallourec
Sandvik AB
KSB AG
Foster Wheeler AG
Schoeller-Bleckmann Oilfield Technology GmbH
Atlas Copco
SBS Oilfield Equipment GmbH
Transocean
Zenith Oilfield Technology
Aker Solutions
Frequently Asked Questions About This Report
Choose License Type
Each market study on Reports Globe will be revised based on COVID-19 impact analysis
How can we help you?
Our salient features
Best Solution
We will help you understand value propositions of various reports across numerous domains and suggest the best possible solution to suffice your research needs.
Customized Research
Our team of analysts and consultants provide assistance for customized research requirements
Max ROI
Guaranteed maximum assistance to help you get your reports at the optimum prices, thereby ensuring maximum returns on investment.
24/7 Support
24X7 availability to help you through the buying process as well as answer any of your doubts.