B2B Corporate Car Sharing Market Size, Share, Growth, Trends, Statistics Analysis Report and By Segment Forecasts 2024 to 2033

Market Overview

The B2B Corporate Car Sharing Market has witnessed substantial growth in recent years, driven by the increasing trend among businesses to adopt more flexible and cost-effective mobility solutions. This market primarily revolves around companies providing vehicles on a shared basis to other businesses, enabling them to optimize their fleet management and reduce operational costs associated with vehicle ownership.

Corporate car sharing services typically offer a range of vehicles, from standard sedans to electric and even autonomous vehicles in some advanced markets. The appeal of corporate car sharing lies in its ability to provide convenient access to vehicles without the burden of ownership, making it particularly attractive for businesses looking to streamline their transportation expenses and enhance employee mobility.

The market dynamics are shaped by the growing emphasis on sustainability and the need for efficient urban mobility solutions. Businesses are increasingly adopting car sharing to reduce their carbon footprint and comply with regulatory requirements aimed at curbing emissions. Moreover, technological advancements in vehicle connectivity and mobile apps have made it easier for businesses to manage their car sharing operations, further driving market growth.

Overall, the B2B Corporate Car Sharing Market is poised for continued expansion as businesses prioritize cost-efficiency, sustainability, and flexibility in managing their transportation needs. The convergence of technology, changing consumer behavior, and regulatory support is expected to fuel further market growth in the coming years.
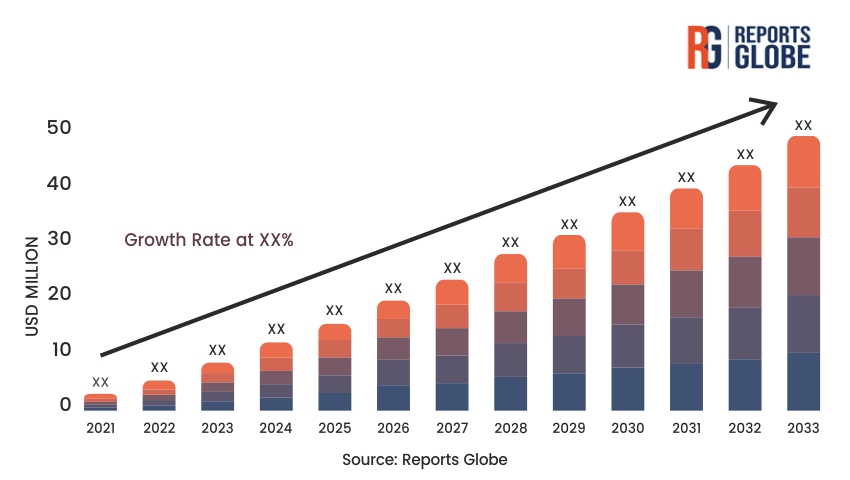
Key Takeaways of the Market

  • Rapid Growth: The market is experiencing rapid growth, fueled by the shift towards sustainable transportation solutions and the need for cost-effective fleet management.
  • Technological Integration: Integration of advanced technologies such as IoT (Internet of Things) and mobile apps is enhancing user experience and operational efficiency.
  • Regulatory Support: Supportive regulatory frameworks promoting shared mobility solutions are driving market expansion globally.
  • Cost Savings: Businesses are leveraging car sharing to reduce fleet management costs, maintenance expenses, and parking overheads.
  • Environmental Benefits: Adoption of corporate car sharing contributes to environmental sustainability by reducing carbon footprints and promoting efficient vehicle utilization.

Market Driver

The adoption of B2B corporate car sharing is primarily driven by several key factors:

Corporate Cost Efficiency: Corporate car sharing allows businesses to optimize fleet utilization, reduce overall transportation costs, and eliminate the financial burden associated with maintaining a large fleet of company-owned vehicles. By sharing vehicles among employees, businesses can minimize idle times and maximize usage efficiency, thereby lowering operational expenses.

Environmental Sustainability: Increasing awareness of environmental issues and the need to reduce carbon emissions is compelling businesses to adopt sustainable transportation solutions like car sharing. Shared mobility programs promote efficient vehicle use, leading to reduced traffic congestion, lower fuel consumption per capita, and decreased greenhouse gas emissions compared to traditional individual vehicle ownership models.

Flexibility and Convenience: Corporate car sharing offers employees flexibility in choosing vehicles according to their specific travel needs, whether for short-term projects, client visits, or daily commuting. This flexibility enhances employee satisfaction, productivity, and work-life balance by providing convenient access to reliable transportation options without the hassles of vehicle ownership.

Technological Advancements: Integration of advanced technologies such as GPS tracking, mobile applications, and automated booking systems enhances the operational efficiency and user experience of corporate car sharing programs. These technologies enable real-time vehicle tracking, remote access, automated billing, and seamless communication between users and fleet managers, streamlining the entire car sharing process.

Market Restraint

Despite its benefits, the B2B corporate car sharing market faces challenges that could hinder its growth:

Initial Implementation Costs: Setting up a corporate car sharing program requires initial investments in vehicle acquisition, technology infrastructure, and operational setup. These upfront costs can be a barrier for smaller businesses or organizations with limited financial resources, slowing down adoption rates.

Security and Liability Concerns: Sharing vehicles among multiple users raises concerns about vehicle security, maintenance, and liability issues in case of accidents, damages, or misuse. Businesses must implement robust security protocols, insurance coverage, and driver screening procedures to mitigate risks and ensure the safety and reliability of shared vehicles.

Cultural Resistance to Change: Some organizations may face internal resistance from employees accustomed to traditional vehicle ownership models. Addressing cultural barriers, promoting the benefits of car sharing, and providing adequate training and support are essential to overcoming resistance and fostering acceptance of shared mobility solutions within corporate settings.

Market Opportunity

The B2B corporate car sharing market presents several opportunities for growth and expansion:

Expansion in Emerging Markets: Emerging economies, particularly in Asia-Pacific, Latin America, and Africa, present untapped opportunities for corporate car sharing providers. Rising urbanization, increasing business travel, and supportive government policies are driving demand for efficient and sustainable mobility solutions among businesses in these regions.

Strategic Partnerships and Collaborations: Collaborations between car sharing providers, technology firms, fleet management companies, and corporate clients offer opportunities to expand service offerings, enhance technological capabilities, and penetrate new market segments. Strategic partnerships can leverage complementary strengths and resources to deliver integrated mobility solutions tailored to the unique needs of corporate clients.

Electric and Autonomous Vehicles: The shift towards electric vehicles (EVs) and autonomous technologies presents opportunities for innovation in corporate car sharing. Integrating electric and autonomous vehicles into car sharing fleets can enhance operational efficiency, reduce environmental impact, and meet evolving corporate sustainability goals. Businesses are increasingly prioritizing eco-friendly transportation options, creating a conducive environment for electric and autonomous vehicle adoption within corporate car sharing programs.

Market Segment Analysis

Technology Adoption in Corporate Car Sharing

The adoption of advanced technologies such as IoT, AI-driven analytics, and mobile apps is revolutionizing corporate car sharing. These technologies enable real-time fleet management, predictive maintenance, and enhanced user experiences through seamless booking and vehicle access processes. Businesses are increasingly investing in smart mobility solutions to streamline operations, optimize fleet utilization, and improve overall efficiency.

Sector-specific Applications

Different sectors exhibit varying adoption rates and requirements for corporate car sharing. Industries such as consulting, technology, and pharmaceuticals, which frequently require employee travel for client meetings and project sites, are early adopters of car sharing solutions. These sectors benefit from cost savings, enhanced mobility, and improved employee productivity facilitated by flexible and efficient transportation options.

Regional Analysis

The adoption of B2B corporate car sharing varies significantly by region:

North America: North America leads in corporate car sharing adoption, driven by robust urbanization, stringent environmental regulations, and high corporate demand for cost-effective mobility solutions. The region’s advanced infrastructure, supportive regulatory environment, and tech-savvy consumer base contribute to market growth.

Europe: Europe follows closely, with widespread adoption of shared mobility solutions across corporate sectors. Government initiatives promoting sustainable transportation, favorable tax incentives for electric vehicles, and well-established car sharing networks in major cities support market expansion in the region.

Asia-Pacific: Asia-Pacific represents a lucrative growth opportunity for corporate car sharing providers, fueled by rapid urbanization, expanding corporate sectors, and increasing awareness of environmental sustainability. Rising business travel, infrastructure development, and government initiatives promoting smart city mobility solutions are driving market growth in countries like China, India, and Japan.

Latin America and Middle East/Africa: These regions are witnessing growing interest in corporate car sharing as businesses seek to optimize fleet management, reduce operational costs, and address urban mobility challenges. Economic growth, infrastructure investments, and supportive government policies are paving the way for expanded adoption of shared mobility solutions among corporate clients.

Competitive Analysis

The B2B Corporate Car Sharing Market is characterized by a competitive landscape marked by a mix of established players and new entrants leveraging innovative business models and technology. Key players in the market include both traditional car rental companies expanding into car sharing and tech-driven startups specializing in mobility solutions. Each player brings unique strengths and strategies to capture a share of this evolving market.

Traditional Rental Companies: Established rental companies such as Enterprise Rent-A-Car and Hertz have ventured into corporate car sharing to diversify their service offerings. These companies leverage their extensive vehicle fleets and operational expertise to cater to corporate clients looking for flexible and scalable transportation solutions. They often provide a seamless integration of car rental and car sharing services, offering a hybrid model that appeals to businesses needing both short-term rentals and long-term car sharing options.

Tech-driven Startups: Startups like Zipcar and Turo have disrupted the car rental industry with innovative technology platforms that enable peer-to-peer and corporate car sharing. These companies focus on enhancing user experience through mobile apps, IoT-enabled vehicles, and advanced booking systems that streamline reservation management and vehicle access. Their agile business models appeal to businesses seeking on-demand access to vehicles without the overhead costs of owning and maintaining a fleet.

Automakers and Mobility Providers: Automotive manufacturers are increasingly entering the corporate car sharing market, offering branded mobility services tailored to business customers. Companies like BMW with ReachNow and Ford with FordPass Mobility Services are examples of automakers leveraging their brand reputation and vehicle quality to attract corporate clients. These initiatives often include exclusive fleet access, customized leasing options, and integrated fleet management solutions that cater specifically to business mobility needs.

Regional and Niche Players: In addition to global players, regional and niche car sharing operators play a significant role in catering to localized market demands and specific business sectors. These players often differentiate themselves through specialized services, such as electric vehicle fleets, dedicated corporate packages, or sector-specific solutions tailored for industries like healthcare, logistics, and public sector organizations.

Partnerships and Collaborations: Collaboration among industry stakeholders, including technology providers, vehicle manufacturers, and urban planners, is becoming increasingly common. Partnerships enable companies to leverage complementary strengths, such as technology expertise, fleet management capabilities, and regulatory knowledge, to address complex mobility challenges and expand market reach.

In conclusion, the B2B Corporate Car Sharing Market is competitive and dynamic, driven by innovation, technology adoption, and strategic partnerships. As businesses continue to prioritize flexibility, cost-efficiency, and sustainability in their transportation strategies, competition among providers is expected to intensify, leading to further advancements in service offerings and customer experience.

Key Industry Developments

  • Introduction of Electric and Autonomous Vehicles: Integration of EVs and autonomous technologies into car sharing fleets to meet sustainability goals and enhance operational efficiency.
  • Adoption of Blockchain for Secure Transactions: Implementation of blockchain technology to enhance data security, transparency, and trust in car sharing transactions.
  • Expansion of Smart Mobility Solutions: Development of smart city initiatives and integrated mobility platforms to promote seamless transportation solutions and enhance user convenience.

Future Outlook

The future outlook for the B2B corporate car sharing market remains promising, driven by ongoing advancements in technology, evolving regulatory landscapes, and shifting consumer preferences towards sustainable and cost-effective mobility solutions. Key trends shaping the market’s trajectory include:

  • Rise of Electric and Autonomous Vehicles: Increasing adoption of EVs and autonomous technologies in corporate car sharing fleets to reduce carbon footprints, enhance operational efficiency, and meet regulatory requirements.
  • Integration of AI and IoT: Continued integration of AI-driven analytics, IoT sensors, and predictive maintenance tools to optimize fleet management, improve asset utilization, and deliver personalized user experiences.
  • Expansion in Emerging Markets: Expansion into emerging economies with growing urbanization, rising disposable incomes, and supportive government policies promoting shared mobility solutions.
  • Focus on Sustainability: Heightened focus on environmental sustainability, with businesses prioritizing eco-friendly transportation options and adopting green mobility initiatives to achieve corporate sustainability goals.

In conclusion, the B2B corporate car sharing market is poised for substantial growth driven by technological innovation, regulatory support, and evolving consumer preferences towards sustainable and efficient transportation solutions. By leveraging these trends and addressing market dynamics effectively, industry players can capitalize on emerging opportunities, expand their market presence, and drive future growth in the competitive landscape of corporate mobility solutions.

Market Segmentation

  • Vehicle Type Segmentation:
    • Sedans
    • SUVs
    • Electric Vehicles (EVs)
    • Autonomous Vehicles (AVs)
  • End-User Segmentation:
    • Small and Medium Enterprises (SMEs)
    • Large Corporations
    • Government Agencies
    • Non-Profit Organizations
  • Service Model Segmentation:
    • Round-trip Car Sharing
    • One-way Car Sharing
    • Peer-to-Peer Car Sharing
  • Regional Segmentation:
    • North America
    • Europe
    • Asia-Pacific
    • Latin America
    • Middle East and Africa

Table of Contents

Chapter 1. Research Methodology & Data Sources

1.1. Data Analysis Models
1.2. Research Scope & Assumptions
1.3. List of Primary & Secondary Data Sources 

Chapter 2. Executive Summary

2.1. Market Overview
2.2. Segment Overview
2.3. Market Size and Estimates, 2021 to 2033
2.4. Market Size and Estimates, By Segments, 2021 to 2033

Chapter 3. Industry Analysis

3.1. Market Segmentation
3.2. Market Definitions and Assumptions
3.3. Supply chain analysis
3.4. Porter’s five forces analysis
3.5. PEST analysis
3.6. Market Dynamics
3.6.1. Market Driver Analysis
3.6.2. Market Restraint analysis
3.6.3. Market Opportunity Analysis
3.7. Competitive Positioning Analysis, 2023
3.8. Key Player Ranking, 2023

Chapter 4. Market Segment Analysis- Segment 1

4.1.1. Historic Market Data & Future Forecasts, 2024-2033
4.1.2. Historic Market Data & Future Forecasts by Region, 2024-2033

Chapter 5. Market Segment Analysis- Segment 2

5.1.1. Historic Market Data & Future Forecasts, 2024-2033
5.1.2. Historic Market Data & Future Forecasts by Region, 2024-2033

Chapter 6. Regional or Country Market Insights

** Reports focusing on a particular region or country will contain data unique to that region or country **

6.1. Global Market Data & Future Forecasts, By Region 2024-2033

6.2. North America
6.2.1. Historic Market Data & Future Forecasts, 2024-2033
6.2.2. Historic Market Data & Future Forecasts, By Segment 1, 2024-2033
6.2.3. Historic Market Data & Future Forecasts, By Segment 2, 2024-2033

6.2.4. U.S.
6.2.4.1. Historic Market Data & Future Forecasts, 2024-2033
6.2.4.2. Historic Market Data & Future Forecasts, By Segment 1, 2024-2033
6.2.4.3. Historic Market Data & Future Forecasts, By Segment 2, 2024-2033

6.2.5. Canada
6.2.5.1. Historic Market Data & Future Forecasts, 2024-2033
6.2.5.2. Historic Market Data & Future Forecasts, By Segment 1, 2024-2033
6.2.5.3. Historic Market Data & Future Forecasts, By Segment 2, 2024-2033

6.3. Europe
6.3.1. Historic Market Data & Future Forecasts, 2024-2033
6.3.2. Historic Market Data & Future Forecasts, By Segment 1, 2024-2033
6.3.3. Historic Market Data & Future Forecasts, By Segment 2, 2024-2033

6.3.4. UK
6.3.4.1. Historic Market Data & Future Forecasts, 2024-2033
6.3.4.2. Historic Market Data & Future Forecasts, By Segment 1, 2024-2033
6.3.4.3. Historic Market Data & Future Forecasts, By Segment 2, 2024-2033

6.3.5. Germany
6.3.5.1. Historic Market Data & Future Forecasts, 2024-2033
6.3.5.2. Historic Market Data & Future Forecasts, By Segment 1, 2024-2033
6.3.5.3. Historic Market Data & Future Forecasts, By Segment 2, 2024-2033

6.3.6. France
6.3.6.1. Historic Market Data & Future Forecasts, 2024-2033
6.3.6.2. Historic Market Data & Future Forecasts, By Segment 1, 2024-2033
6.3.6.3. Historic Market Data & Future Forecasts, By Segment 2, 2024-2033

6.4. Asia Pacific
6.4.1. Historic Market Data & Future Forecasts, 2024-2033
6.4.2. Historic Market Data & Future Forecasts, By Segment 1, 2024-2033
6.4.3. Historic Market Data & Future Forecasts, By Segment 2, 2024-2033

6.4.4. China
6.4.4.1. Historic Market Data & Future Forecasts, 2024-2033
6.4.4.2. Historic Market Data & Future Forecasts, By Segment 1, 2024-2033
6.4.4.3. Historic Market Data & Future Forecasts, By Segment 2, 2024-2033

6.4.5. India
6.4.5.1. Historic Market Data & Future Forecasts, 2024-2033
6.4.5.2. Historic Market Data & Future Forecasts, By Segment 1, 2024-2033
6.4.5.3. Historic Market Data & Future Forecasts, By Segment 2, 2024-2033

6.4.6. Japan
6.4.6.1. Historic Market Data & Future Forecasts, 2024-2033
6.4.6.2. Historic Market Data & Future Forecasts, By Segment 1, 2024-2033
6.4.6.3. Historic Market Data & Future Forecasts, By Segment 2, 2024-2033

6.4.7. South Korea
6.4.7.1. Historic Market Data & Future Forecasts, 2024-2033
6.4.7.2. Historic Market Data & Future Forecasts, By Segment 1, 2024-2033
6.4.7.3. Historic Market Data & Future Forecasts, By Segment 2, 2024-2033

6.5. Latin America
6.5.1. Historic Market Data & Future Forecasts, 2024-2033
6.5.2. Historic Market Data & Future Forecasts, By Segment 1, 2024-2033
6.5.3. Historic Market Data & Future Forecasts, By Segment 2, 2024-2033

6.5.4. Brazil
6.5.4.1. Historic Market Data & Future Forecasts, 2024-2033
6.5.4.2. Historic Market Data & Future Forecasts, By Segment 1, 2024-2033
6.5.4.3. Historic Market Data & Future Forecasts, By Segment 2, 2024-2033

6.5.5. Mexico
6.5.5.1. Historic Market Data & Future Forecasts, 2024-2033
6.5.5.2. Historic Market Data & Future Forecasts, By Segment 1, 2024-2033
6.5.5.3. Historic Market Data & Future Forecasts, By Segment 2, 2024-2033

6.6. Middle East & Africa
6.6.1. Historic Market Data & Future Forecasts, 2024-2033
6.6.2. Historic Market Data & Future Forecasts, By Segment 1, 2024-2033
6.6.3. Historic Market Data & Future Forecasts, By Segment 2, 2024-2033

6.6.4. UAE
6.6.4.1. Historic Market Data & Future Forecasts, 2024-2033
6.6.4.2. Historic Market Data & Future Forecasts, By Segment 1, 2024-2033
6.6.4.3. Historic Market Data & Future Forecasts, By Segment 2, 2024-2033

6.6.5. Saudi Arabia
6.6.5.1. Historic Market Data & Future Forecasts, 2024-2033
6.6.5.2. Historic Market Data & Future Forecasts, By Segment 1, 2024-2033
6.6.5.3. Historic Market Data & Future Forecasts, By Segment 2, 2024-2033

6.6.6. South Africa
6.6.6.1. Historic Market Data & Future Forecasts, 2024-2033
6.6.6.2. Historic Market Data & Future Forecasts, By Segment 1, 2024-2033
6.6.6.3. Historic Market Data & Future Forecasts, By Segment 2, 2024-2033

Chapter 7. Competitive Landscape

7.1. Competitive Heatmap Analysis, 2023
7.2. Competitive Product Analysis

7.3. Company 1
7.3.1. Company Description
7.3.2. Financial Highlights
7.3.3. Product Portfolio
7.3.4. Strategic Initiatives

7.4. Company 2
7.4.1. Company Description
7.4.2. Financial Highlights
7.4.3. Product Portfolio
7.4.4. Strategic Initiatives

7.5. Company 3
7.5.1. Company Description
7.5.2. Financial Highlights
7.5.3. Product Portfolio
7.5.4. Strategic Initiatives

7.6. Company 4
7.6.1. Company Description
7.6.2. Financial Highlights
7.6.3. Product Portfolio
7.6.4. Strategic Initiatives

7.7. Company 5
7.7.1. Company Description
7.7.2. Financial Highlights
7.7.3. Product Portfolio
7.7.4. Strategic Initiatives

7.8. Company 6
7.8.1. Company Description
7.8.2. Financial Highlights
7.8.3. Product Portfolio
7.8.4. Strategic Initiatives

7.9. Company 7
7.9.1. Company Description
7.9.2. Financial Highlights
7.9.3. Product Portfolio
7.9.4. Strategic Initiatives

7.10. Company 8
7.10.1. Company Description
7.10.2. Financial Highlights
7.10.3. Product Portfolio
7.10.4. Strategic Initiatives

7.11. Company 9
7.11.1. Company Description
7.11.2. Financial Highlights
7.11.3. Product Portfolio
7.11.4. Strategic Initiatives

7.12. Company 10
7.12.1. Company Description
7.12.2. Financial Highlights
7.12.3. Product Portfolio
7.12.4. Strategic Initiatives

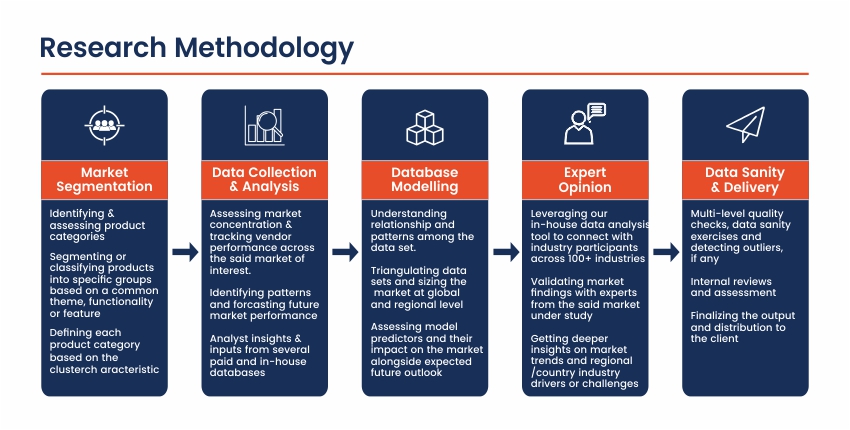
Research Methodology

Frequently Asked Questions About This Report

Choose License Type

$3,240
$3,780
$4,410

Our salient features

Best Solution

We will assist you in comprehending the value propositions of various reports across multiple domains and recommend the optimal solution to meet your research requirements.

Customized Research

Our team of analysts and consultants provide assistance for customized research requirements

Max ROI

Guaranteed maximum assistance to help you get your reports at the optimum prices, thereby ensuring maximum returns on investment.

24/7 Support

24X7 availability to help you through the buying process as well as answer any of your doubts.

Get a free sample report

This free sample study provides a comprehensive overview of the report, including an executive summary, market segments, complete analysis, country-level analysis, and more.

Our Clients

We've Received Your Request

We Thank You for filling out your requirements. Our sales team will get in touch with you shortly.