Asia Pacific Sports Nutrition Market Size, Share, Growth, Trends, Statistics Analysis Report and By Segment Forecasts 2024 to 2033

Market Overview

The Asia Pacific sports nutrition market has experienced significant growth in recent years and is expected to continue expanding at a rapid pace. Rising disposable incomes, increasing health consciousness, and a growing interest in fitness and athletic performance are key factors driving market growth in the region. The market encompasses a wide range of products, including protein powders, energy bars, sports drinks, and dietary supplements, which cater to both professional athletes and recreational fitness enthusiasts. The increasing prevalence of e-commerce and online retail channels has further facilitated easy access to sports nutrition products for consumers across the Asia Pacific region.

China, Japan, and India are the major markets for sports nutrition products in the Asia Pacific, with a significant presence of international and domestic players. The rising popularity of sports events, such as the Olympics and Asian Games, has also contributed to the growth of the sports nutrition market in the region. Moreover, the expanding middle class and urbanization in developing countries have led to increased participation in fitness activities and a greater demand for sports nutrition products.

The Asia Pacific sports nutrition market is highly competitive, with key players focusing on product innovation, marketing strategies, and expanding their distribution networks to gain market share. Companies are also investing in research and development to create products tailored to the specific needs and preferences of Asian consumers, taking into account cultural and dietary differences.
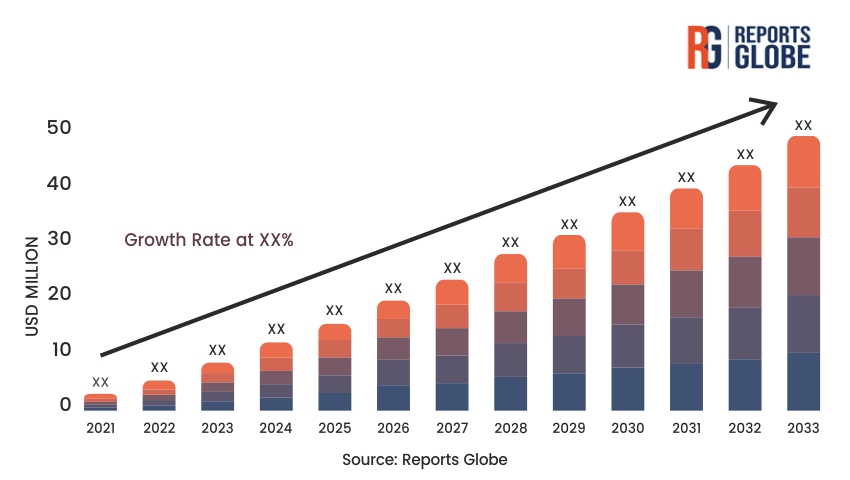
Key Takeaways of the market

  • Rising disposable incomes and growing health consciousness are major drivers for the Asia Pacific sports nutrition market.
  • China, Japan, and India are the key markets for sports nutrition products in the region.
  • Online retail and e-commerce platforms have made sports nutrition products more accessible to consumers.
  • Product innovation and customization to suit Asian consumer preferences are key strategies for market players.
  • The market is expected to witness strong growth in the coming years, driven by increasing participation in fitness activities and rising demand for sports nutrition products.

Market Driver

One of the primary drivers of the Asia Pacific sports nutrition market is the increasing health consciousness among consumers in the region. With rising disposable incomes and greater access to information, more people are becoming aware of the importance of maintaining a healthy lifestyle through proper nutrition and regular exercise. This trend has led to a surge in demand for sports nutrition products, such as protein powders, energy bars, and dietary supplements, which are perceived to enhance athletic performance, support muscle growth and recovery, and improve overall health and well-being.

Moreover, the growing popularity of fitness centers, gyms, and sports clubs across the Asia Pacific region has further fueled the demand for sports nutrition products. As more people engage in regular exercise and recreational sports activities, they are increasingly turning to sports nutrition products to support their fitness goals and optimize their performance.

Market Restraint

Despite the promising growth prospects, the Asia Pacific sports nutrition market faces certain restraints that could hinder its expansion. One of the major challenges is the high cost of sports nutrition products compared to regular food items, which may deter price-sensitive consumers from purchasing them. The premium pricing of many sports nutrition brands can make them less accessible to the mass market, particularly in developing countries where disposable incomes are relatively lower.

Another restraint is the lack of regulation and quality control in some markets, which has led to the proliferation of counterfeit and substandard products. The presence of fake or inferior products can erode consumer trust and hamper the growth of the legitimate sports nutrition market. Moreover, cultural and social norms in some Asian countries may discourage the consumption of certain sports nutrition products, such as those containing animal-derived ingredients, which can limit their adoption.

Market Opportunity

The Asia Pacific sports nutrition market presents several opportunities for growth and expansion. One of the key opportunities lies in the development of innovative and customized products that cater to the specific needs and preferences of Asian consumers. Companies that can create products with locally sourced ingredients, flavors that appeal to regional tastes, and formulations that align with cultural and dietary habits can gain a competitive edge in the market.

Another opportunity is the increasing demand for plant-based and vegan sports nutrition products. As more consumers in the Asia Pacific region adopt plant-based diets for health, environmental, or ethical reasons, there is a growing market for sports nutrition products that are free from animal-derived ingredients. Companies that can offer high-quality, plant-based alternatives to traditional sports nutrition products can tap into this emerging segment and capture a larger market share.

The rise of e-commerce and digital marketing channels also presents an opportunity for sports nutrition brands to reach a wider audience and engage with consumers directly. By leveraging online platforms and social media, companies can build brand awareness, educate consumers about the benefits of their products, and drive sales through targeted marketing campaigns and promotions.

Market Segment Analysis

  1. Protein Powder Segment: Protein powders are one of the largest and fastest-growing segments in the Asia Pacific sports nutrition market. The increasing awareness about the importance of protein in building and repairing muscles, coupled with the convenience and versatility of protein powders, has fueled their demand among fitness enthusiasts and athletes. Whey protein is the most popular type of protein powder, but there is also a growing demand for plant-based alternatives, such as soy, pea, and rice protein powders. The protein powder segment is expected to witness strong growth in the coming years, driven by product innovations, such as the development of new flavors and formulations, and the expansion of distribution channels.
  2. Energy Bars Segment: Energy bars are another popular segment in the Asia Pacific sports nutrition market, particularly among consumers who lead busy lifestyles and seek convenient, on-the-go nutrition options. Energy bars are designed to provide a quick and sustained release of energy, making them ideal for pre- and post-workout consumption, as well as for snacking between meals. The energy bar segment is highly competitive, with a wide range of brands and products available in the market. Companies are focusing on developing energy bars with unique flavor combinations, clean label ingredients, and functional benefits, such as added protein or fiber, to differentiate themselves from competitors and attract health-conscious consumers.

Regional Analysis

The Asia Pacific sports nutrition market exhibits significant regional variations, with different countries showing distinct growth patterns and consumer preferences. China is the largest market for sports nutrition products in the region, driven by a massive population, rising disposable incomes, and increasing health awareness. The Chinese market is characterized by a strong presence of international brands, as well as a growing number of domestic players. Japan is another key market, with a well-established fitness culture and a high demand for premium, science-backed sports nutrition products. The Japanese market is known for its stringent quality standards and a preference for clean label and natural ingredients.

India is an emerging market for sports nutrition products, with a large, young population and a growing interest in fitness and sports. The Indian market is price-sensitive, but there is a rising demand for high-quality, branded products among affluent urban consumers. Southeast Asian countries, such as Indonesia, Thailand, and Vietnam, are also experiencing strong growth in the sports nutrition market, driven by rising disposable incomes, urbanization, and changing lifestyles. These markets present significant opportunities for international brands, as well as local players who can offer products tailored to regional preferences and price points.

Competitive Analysis

The Asia Pacific sports nutrition market is highly competitive, with a mix of international and domestic players vying for market share. Leading international brands, such as Optimum Nutrition, Myprotein, and Musclepharm, have a strong presence in the region, leveraging their global brand recognition and extensive distribution networks. These brands often command premium prices and target affluent, fitness-focused consumers.

However, domestic players are increasingly challenging the dominance of international brands by offering high-quality products at more affordable prices. Companies such as Iovate Health Sciences International (China), Amway (China), and Muscletech (India) have established a strong foothold in their respective markets by catering to local consumer preferences and price points.

The competitive landscape is also characterized by intense product innovation and marketing activities. Companies are investing heavily in research and development to create new and improved formulations, as well as in marketing and promotional campaigns to build brand awareness and loyalty. Collaborations with fitness influencers, sponsorships of sports events, and digital marketing strategies are key tactics used by market players to reach and engage with their target audiences.

Key Industry Developments

  • In 2021, Glanbia plc, a global nutrition company, acquired LevlUp, a leading brand of functional energy bars in China, to expand its presence in the rapidly growing Chinese market.
  • In 2022, Myprotein launched a new range of vegan protein powders in India, made from locally sourced ingredients such as chickpea and mung bean, to cater to the growing demand for plant-based nutrition products.
  • In 2023, Amway China partnered with the Chinese Olympic Committee to become the official sports nutrition supplier for Chinese athletes, boosting its brand credibility and visibility in the market.
  • In 2024, Iovate Health Sciences International introduced a new line of pre-workout supplements in Southeast Asia, featuring novel ingredients and flavors inspired by popular local fruits and herbs.

Future Outlook

The Asia Pacific sports nutrition market is poised for strong growth in the coming years, driven by rising health consciousness, increasing disposable incomes, and the growing popularity of fitness and sports activities in the region. The market is expected to witness a compound annual growth rate (CAGR) of around 10-12% between 2024 and 2029, with China, Japan, and India being the key growth engines.

The future of the market will be shaped by several trends and drivers, such as the increasing demand for personalized nutrition solutions, the rise of e-commerce and digital channels, and the growing importance of sustainability and clean label products. Companies that can innovate and adapt to these trends, while also catering to local consumer preferences and price points, will be well-positioned to succeed in the highly competitive Asia Pacific sports nutrition market.

However, the market will also face certain challenges, such as the need for stricter regulation and quality control, the threat of counterfeit products, and the potential impact of economic and political uncertainties in some countries. Despite these challenges, the long-term prospects for the Asia Pacific sports nutrition market remain positive, supported by the region’s large and growing population, rising middle class, and increasing health awareness.

Market Segmentation

The Asia Pacific sports nutrition market can be segmented based on various factors, including:

  • Product Type:
    • Protein Powders
    • Energy Bars
    • Sports Drinks
    • Pre-Workout Supplements
    • Post-Workout Supplements
    • Others
  • Distribution Channel:
    • Brick and Mortar Stores
      • Specialty Stores
      • Supermarkets/Hypermarkets
      • Pharmacies
    • Online Stores
  • End-User:
    • Athletes
    • Bodybuilders
    • Recreational Users
    • Lifestyle Users
  • Geography:
    • China
    • Japan
    • India
    • South Korea
    • Australia and New Zealand
    • Southeast Asia
      • Indonesia
      • Thailand
      • Vietnam
      • Philippines
      • Malaysia
      • Singapore
    • Rest of Asia Pacific

Table of Contents

Chapter 1. Research Methodology & Data Sources

1.1. Data Analysis Models
1.2. Research Scope & Assumptions
1.3. List of Primary & Secondary Data Sources 

Chapter 2. Executive Summary

2.1. Market Overview
2.2. Segment Overview
2.3. Market Size and Estimates, 2021 to 2033
2.4. Market Size and Estimates, By Segments, 2021 to 2033

Chapter 3. Industry Analysis

3.1. Market Segmentation
3.2. Market Definitions and Assumptions
3.3. Supply chain analysis
3.4. Porter’s five forces analysis
3.5. PEST analysis
3.6. Market Dynamics
3.6.1. Market Driver Analysis
3.6.2. Market Restraint analysis
3.6.3. Market Opportunity Analysis
3.7. Competitive Positioning Analysis, 2023
3.8. Key Player Ranking, 2023

Chapter 4. Market Segment Analysis- Segment 1

4.1.1. Historic Market Data & Future Forecasts, 2024-2033
4.1.2. Historic Market Data & Future Forecasts by Region, 2024-2033

Chapter 5. Market Segment Analysis- Segment 2

5.1.1. Historic Market Data & Future Forecasts, 2024-2033
5.1.2. Historic Market Data & Future Forecasts by Region, 2024-2033

Chapter 6. Regional or Country Market Insights

** Reports focusing on a particular region or country will contain data unique to that region or country **

6.1. Global Market Data & Future Forecasts, By Region 2024-2033

6.2. North America
6.2.1. Historic Market Data & Future Forecasts, 2024-2033
6.2.2. Historic Market Data & Future Forecasts, By Segment 1, 2024-2033
6.2.3. Historic Market Data & Future Forecasts, By Segment 2, 2024-2033

6.2.4. U.S.
6.2.4.1. Historic Market Data & Future Forecasts, 2024-2033
6.2.4.2. Historic Market Data & Future Forecasts, By Segment 1, 2024-2033
6.2.4.3. Historic Market Data & Future Forecasts, By Segment 2, 2024-2033

6.2.5. Canada
6.2.5.1. Historic Market Data & Future Forecasts, 2024-2033
6.2.5.2. Historic Market Data & Future Forecasts, By Segment 1, 2024-2033
6.2.5.3. Historic Market Data & Future Forecasts, By Segment 2, 2024-2033

6.3. Europe
6.3.1. Historic Market Data & Future Forecasts, 2024-2033
6.3.2. Historic Market Data & Future Forecasts, By Segment 1, 2024-2033
6.3.3. Historic Market Data & Future Forecasts, By Segment 2, 2024-2033

6.3.4. UK
6.3.4.1. Historic Market Data & Future Forecasts, 2024-2033
6.3.4.2. Historic Market Data & Future Forecasts, By Segment 1, 2024-2033
6.3.4.3. Historic Market Data & Future Forecasts, By Segment 2, 2024-2033

6.3.5. Germany
6.3.5.1. Historic Market Data & Future Forecasts, 2024-2033
6.3.5.2. Historic Market Data & Future Forecasts, By Segment 1, 2024-2033
6.3.5.3. Historic Market Data & Future Forecasts, By Segment 2, 2024-2033

6.3.6. France
6.3.6.1. Historic Market Data & Future Forecasts, 2024-2033
6.3.6.2. Historic Market Data & Future Forecasts, By Segment 1, 2024-2033
6.3.6.3. Historic Market Data & Future Forecasts, By Segment 2, 2024-2033

6.4. Asia Pacific
6.4.1. Historic Market Data & Future Forecasts, 2024-2033
6.4.2. Historic Market Data & Future Forecasts, By Segment 1, 2024-2033
6.4.3. Historic Market Data & Future Forecasts, By Segment 2, 2024-2033

6.4.4. China
6.4.4.1. Historic Market Data & Future Forecasts, 2024-2033
6.4.4.2. Historic Market Data & Future Forecasts, By Segment 1, 2024-2033
6.4.4.3. Historic Market Data & Future Forecasts, By Segment 2, 2024-2033

6.4.5. India
6.4.5.1. Historic Market Data & Future Forecasts, 2024-2033
6.4.5.2. Historic Market Data & Future Forecasts, By Segment 1, 2024-2033
6.4.5.3. Historic Market Data & Future Forecasts, By Segment 2, 2024-2033

6.4.6. Japan
6.4.6.1. Historic Market Data & Future Forecasts, 2024-2033
6.4.6.2. Historic Market Data & Future Forecasts, By Segment 1, 2024-2033
6.4.6.3. Historic Market Data & Future Forecasts, By Segment 2, 2024-2033

6.4.7. South Korea
6.4.7.1. Historic Market Data & Future Forecasts, 2024-2033
6.4.7.2. Historic Market Data & Future Forecasts, By Segment 1, 2024-2033
6.4.7.3. Historic Market Data & Future Forecasts, By Segment 2, 2024-2033

6.5. Latin America
6.5.1. Historic Market Data & Future Forecasts, 2024-2033
6.5.2. Historic Market Data & Future Forecasts, By Segment 1, 2024-2033
6.5.3. Historic Market Data & Future Forecasts, By Segment 2, 2024-2033

6.5.4. Brazil
6.5.4.1. Historic Market Data & Future Forecasts, 2024-2033
6.5.4.2. Historic Market Data & Future Forecasts, By Segment 1, 2024-2033
6.5.4.3. Historic Market Data & Future Forecasts, By Segment 2, 2024-2033

6.5.5. Mexico
6.5.5.1. Historic Market Data & Future Forecasts, 2024-2033
6.5.5.2. Historic Market Data & Future Forecasts, By Segment 1, 2024-2033
6.5.5.3. Historic Market Data & Future Forecasts, By Segment 2, 2024-2033

6.6. Middle East & Africa
6.6.1. Historic Market Data & Future Forecasts, 2024-2033
6.6.2. Historic Market Data & Future Forecasts, By Segment 1, 2024-2033
6.6.3. Historic Market Data & Future Forecasts, By Segment 2, 2024-2033

6.6.4. UAE
6.6.4.1. Historic Market Data & Future Forecasts, 2024-2033
6.6.4.2. Historic Market Data & Future Forecasts, By Segment 1, 2024-2033
6.6.4.3. Historic Market Data & Future Forecasts, By Segment 2, 2024-2033

6.6.5. Saudi Arabia
6.6.5.1. Historic Market Data & Future Forecasts, 2024-2033
6.6.5.2. Historic Market Data & Future Forecasts, By Segment 1, 2024-2033
6.6.5.3. Historic Market Data & Future Forecasts, By Segment 2, 2024-2033

6.6.6. South Africa
6.6.6.1. Historic Market Data & Future Forecasts, 2024-2033
6.6.6.2. Historic Market Data & Future Forecasts, By Segment 1, 2024-2033
6.6.6.3. Historic Market Data & Future Forecasts, By Segment 2, 2024-2033

Chapter 7. Competitive Landscape

7.1. Competitive Heatmap Analysis, 2023
7.2. Competitive Product Analysis

7.3. Company 1
7.3.1. Company Description
7.3.2. Financial Highlights
7.3.3. Product Portfolio
7.3.4. Strategic Initiatives

7.4. Company 2
7.4.1. Company Description
7.4.2. Financial Highlights
7.4.3. Product Portfolio
7.4.4. Strategic Initiatives

7.5. Company 3
7.5.1. Company Description
7.5.2. Financial Highlights
7.5.3. Product Portfolio
7.5.4. Strategic Initiatives

7.6. Company 4
7.6.1. Company Description
7.6.2. Financial Highlights
7.6.3. Product Portfolio
7.6.4. Strategic Initiatives

7.7. Company 5
7.7.1. Company Description
7.7.2. Financial Highlights
7.7.3. Product Portfolio
7.7.4. Strategic Initiatives

7.8. Company 6
7.8.1. Company Description
7.8.2. Financial Highlights
7.8.3. Product Portfolio
7.8.4. Strategic Initiatives

7.9. Company 7
7.9.1. Company Description
7.9.2. Financial Highlights
7.9.3. Product Portfolio
7.9.4. Strategic Initiatives

7.10. Company 8
7.10.1. Company Description
7.10.2. Financial Highlights
7.10.3. Product Portfolio
7.10.4. Strategic Initiatives

7.11. Company 9
7.11.1. Company Description
7.11.2. Financial Highlights
7.11.3. Product Portfolio
7.11.4. Strategic Initiatives

7.12. Company 10
7.12.1. Company Description
7.12.2. Financial Highlights
7.12.3. Product Portfolio
7.12.4. Strategic Initiatives

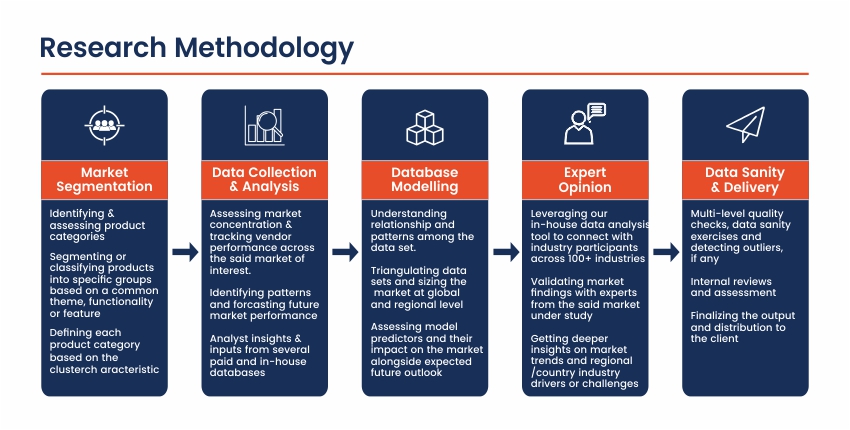
Research Methodology

Frequently Asked Questions About This Report

Choose License Type

$2,430
$2,970
$3,510

Our salient features

Best Solution

We will assist you in comprehending the value propositions of various reports across multiple domains and recommend the optimal solution to meet your research requirements.

Customized Research

Our team of analysts and consultants provide assistance for customized research requirements

Max ROI

Guaranteed maximum assistance to help you get your reports at the optimum prices, thereby ensuring maximum returns on investment.

24/7 Support

24X7 availability to help you through the buying process as well as answer any of your doubts.

Get a free sample report

This free sample study provides a comprehensive overview of the report, including an executive summary, market segments, complete analysis, country-level analysis, and more.

Our Clients

We've Received Your Request

We Thank You for filling out your requirements. Our sales team will get in touch with you shortly.