Africa Virtual Cards Market Size, Share, Growth, Trends, Statistics Analysis Report and By Segment Forecasts 2024 to 2033

Market Overview: The Africa Virtual Cards Market is experiencing robust growth driven by the increasing adoption of digital payment solutions, rising e-commerce activities, and the need for secure and convenient payment methods. Virtual cards, also known as digital cards or tokenized cards, are virtual representations of physical payment cards that are used for online transactions. These cards are issued by financial institutions or payment service providers and are linked to a user’s existing debit or credit card account. They offer enhanced security features such as one-time use, spending limits, and real-time transaction monitoring, making them popular among consumers and businesses alike. The market is witnessing significant investments in technological advancements, regulatory support, and strategic partnerships, further fueling its growth trajectory.
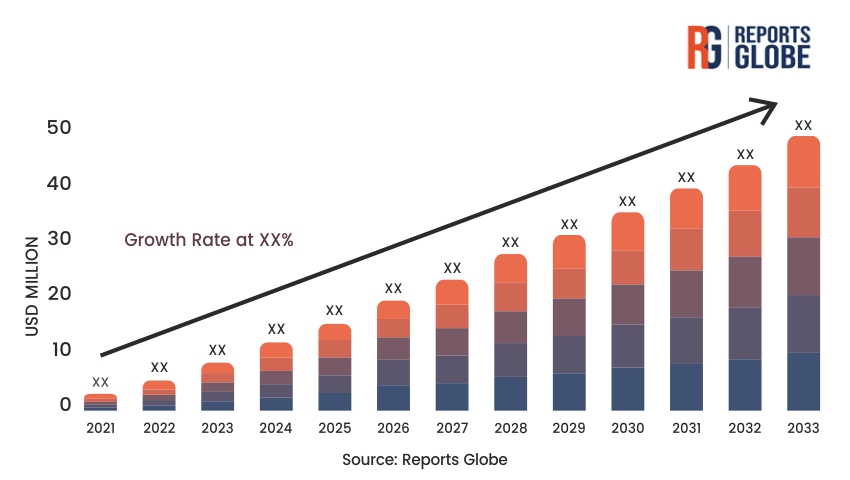
Key Takeaways of the Market:

  • Rapid adoption of digital payment solutions is driving the growth of the Africa Virtual Cards Market.
  • Virtual cards offer enhanced security features, such as one-time use and spending limits, making them popular among consumers and businesses.
  • The increasing prevalence of e-commerce activities and the need for secure online transactions are driving the demand for virtual cards.
  • Technological advancements, regulatory support, and strategic partnerships are fueling the growth of the market.

Market Driver: The primary driver of the Africa Virtual Cards Market is the rapid adoption of digital payment solutions across the region. With the increasing penetration of smartphones, improved internet connectivity, and growing consumer awareness, digital payments have become the preferred choice for conducting financial transactions. Virtual cards offer several advantages over traditional payment methods, including enhanced security, convenience, and flexibility. Additionally, the rise of e-commerce activities, spurred by factors such as urbanization, changing consumer preferences, and the COVID-19 pandemic, has further accelerated the demand for virtual cards. Moreover, regulatory initiatives aimed at promoting electronic payments and financial inclusion are driving the adoption of virtual cards among unbanked and underbanked populations, contributing to the market growth.

Market Restraint: Despite the promising growth prospects, the Africa Virtual Cards Market faces certain challenges that may impede its growth. One of the primary concerns is the lack of widespread acceptance and infrastructure readiness for digital payments, particularly in rural and remote areas. Limited internet connectivity, low levels of financial literacy, and security concerns related to online transactions pose challenges to the adoption of virtual cards among certain segments of the population. Moreover, regulatory uncertainties and compliance issues may hinder market growth, as financial institutions and payment service providers navigate the evolving regulatory landscape. Additionally, the presence of alternative payment methods, such as mobile money and cash-on-delivery, may pose competition to virtual cards in certain market segments.

Market Opportunity: Despite the challenges, the Africa Virtual Cards Market presents significant opportunities for growth and expansion. With the increasing adoption of smartphones and internet-enabled devices, the addressable market for virtual cards is expanding rapidly. Moreover, the growing popularity of e-commerce platforms and the shift towards contactless payments present lucrative opportunities for virtual card issuers and payment service providers. Additionally, initiatives aimed at promoting financial inclusion and digital literacy are creating new avenues for market penetration, particularly among underserved populations. Furthermore, strategic partnerships between financial institutions, fintech companies, and e-commerce platforms can help drive adoption and unlock new revenue streams in the virtual cards market.

Market Segment Analysis:

  1. Consumer Segment: The consumer segment accounts for a significant share of the Africa Virtual Cards Market, driven by the increasing adoption of digital payment solutions among consumers. Virtual cards offer consumers a secure and convenient way to make online transactions without the need to disclose sensitive payment information. With the rise of e-commerce activities and the growing preference for online shopping, virtual cards are becoming increasingly popular among consumers for making purchases on e-commerce platforms, booking travel accommodations, and subscribing to digital services. Moreover, the ability to set spending limits and control transaction parameters appeals to budget-conscious consumers, further driving the demand for virtual cards in the consumer segment.
  2. Corporate Segment: The corporate segment represents another key market for virtual cards in Africa, driven by the need for secure and efficient payment solutions among businesses. Virtual cards offer corporate clients enhanced control, visibility, and security over their payment processes, making them ideal for managing business expenses, procurement, and vendor payments. With the increasing digitization of business operations and the rise of remote work arrangements, virtual cards are gaining traction among corporate clients for managing employee expenses, conducting online purchases, and streamlining payment workflows. Additionally, the ability to integrate virtual card solutions with existing accounting and ERP systems provides businesses with greater transparency and efficiency in financial management

Regional Analysis:

The Africa virtual cards market exhibits significant regional variations in terms of adoption and growth. In North Africa, countries like Egypt, Morocco, and Algeria are witnessing a surge in virtual card usage due to increasing internet penetration and the rise of digital banking services. Similarly, in West Africa, countries such as Nigeria and Ghana are experiencing a growing demand for virtual cards driven by the expansion of e-commerce platforms and the need for secure online transactions. East Africa, particularly Kenya and Ethiopia, is also witnessing an uptick in virtual card adoption, fueled by the proliferation of mobile payment solutions and the digitization of financial services. Central Africa and Southern Africa, while relatively nascent markets for virtual cards, are expected to show promising growth prospects in the coming years as awareness about the benefits of virtual payment methods increases.

Competitive Analysis:

The Africa virtual cards market is characterized by intense competition among key players striving to enhance their market presence and gain a competitive edge. Leading financial technology companies such as Flutterwave, Paystack, and Paga are actively investing in virtual card solutions to cater to the evolving needs of consumers and businesses. Traditional banks and financial institutions are also entering the virtual cards space by launching their own digital banking platforms and offering virtual card services to customers. Moreover, partnerships and collaborations between fintech firms, payment processors, and e-commerce platforms are becoming increasingly common as companies seek to leverage synergies and expand their market reach. In this competitive landscape, innovation, security, and user experience emerge as critical differentiators, driving companies to continually enhance their virtual card offerings and stay ahead of the curve.

Key Industry Developments:

  • Regulatory initiatives aimed at promoting electronic payments and financial inclusion are driving the adoption of virtual cards in Africa.
  • Technological advancements, such as tokenization and biometric authentication, are enhancing the security features of virtual cards, boosting consumer confidence.
  • Strategic partnerships between financial institutions, fintech companies, and e-commerce platforms are facilitating the integration of virtual card solutions and expanding market reach.
  • The COVID-19 pandemic has accelerated the shift towards digital payments and contactless transactions, further driving the demand for virtual cards in Africa.

Future Outlook

The Africa Virtual Cards Market is poised for significant growth in the coming years, driven by the increasing adoption of digital payment solutions, rising e-commerce activities, and regulatory support for electronic payments. As smartphone penetration and internet connectivity continue to improve across the region, the addressable market for virtual cards is expected to expand rapidly. Moreover, advancements in technology, such as artificial intelligence and machine learning, are likely to further enhance the security and functionality of virtual cards, driving their adoption among consumers and businesses alike. Strategic partnerships and collaborations between industry players are expected to fuel innovation and drive market growth. Additionally, initiatives aimed at promoting financial inclusion and digital literacy are likely to create new opportunities for market penetration, particularly among underserved populations. Overall, the future outlook for the Africa Virtual Cards Market remains highly promising, with substantial growth potential in the years to come.

Market Segmentation:

  • By Type:
    • Single-Use Virtual Cards
    • Multi-Use Virtual Cards
    • Disposable Virtual Cards
  • By Application:
    • E-Commerce Transactions
    • Online Subscription Services
    • Business Expenses Management
    • Travel and Expense Management
  • By End User:
    • Individual Consumers
    • Small and Medium Enterprises (SMEs)
    • Large Enterprises
  • By Region:
    • North Africa
    • West Africa
    • East Africa
    • Central Africa
    • Southern Africa

Table of Contents

Chapter 1. Research Methodology & Data Sources

1.1. Data Analysis Models
1.2. Research Scope & Assumptions
1.3. List of Primary & Secondary Data Sources 

Chapter 2. Executive Summary

2.1. Market Overview
2.2. Segment Overview
2.3. Market Size and Estimates, 2021 to 2033
2.4. Market Size and Estimates, By Segments, 2021 to 2033

Chapter 3. Industry Analysis

3.1. Market Segmentation
3.2. Market Definitions and Assumptions
3.3. Supply chain analysis
3.4. Porter’s five forces analysis
3.5. PEST analysis
3.6. Market Dynamics
3.6.1. Market Driver Analysis
3.6.2. Market Restraint analysis
3.6.3. Market Opportunity Analysis
3.7. Competitive Positioning Analysis, 2023
3.8. Key Player Ranking, 2023

Chapter 4. Market Segment Analysis- Segment 1

4.1.1. Historic Market Data & Future Forecasts, 2024-2033
4.1.2. Historic Market Data & Future Forecasts by Region, 2024-2033

Chapter 5. Market Segment Analysis- Segment 2

5.1.1. Historic Market Data & Future Forecasts, 2024-2033
5.1.2. Historic Market Data & Future Forecasts by Region, 2024-2033

Chapter 6. Regional or Country Market Insights

** Reports focusing on a particular region or country will contain data unique to that region or country **

6.1. Global Market Data & Future Forecasts, By Region 2024-2033

6.2. North America
6.2.1. Historic Market Data & Future Forecasts, 2024-2033
6.2.2. Historic Market Data & Future Forecasts, By Segment 1, 2024-2033
6.2.3. Historic Market Data & Future Forecasts, By Segment 2, 2024-2033

6.2.4. U.S.
6.2.4.1. Historic Market Data & Future Forecasts, 2024-2033
6.2.4.2. Historic Market Data & Future Forecasts, By Segment 1, 2024-2033
6.2.4.3. Historic Market Data & Future Forecasts, By Segment 2, 2024-2033

6.2.5. Canada
6.2.5.1. Historic Market Data & Future Forecasts, 2024-2033
6.2.5.2. Historic Market Data & Future Forecasts, By Segment 1, 2024-2033
6.2.5.3. Historic Market Data & Future Forecasts, By Segment 2, 2024-2033

6.3. Europe
6.3.1. Historic Market Data & Future Forecasts, 2024-2033
6.3.2. Historic Market Data & Future Forecasts, By Segment 1, 2024-2033
6.3.3. Historic Market Data & Future Forecasts, By Segment 2, 2024-2033

6.3.4. UK
6.3.4.1. Historic Market Data & Future Forecasts, 2024-2033
6.3.4.2. Historic Market Data & Future Forecasts, By Segment 1, 2024-2033
6.3.4.3. Historic Market Data & Future Forecasts, By Segment 2, 2024-2033

6.3.5. Germany
6.3.5.1. Historic Market Data & Future Forecasts, 2024-2033
6.3.5.2. Historic Market Data & Future Forecasts, By Segment 1, 2024-2033
6.3.5.3. Historic Market Data & Future Forecasts, By Segment 2, 2024-2033

6.3.6. France
6.3.6.1. Historic Market Data & Future Forecasts, 2024-2033
6.3.6.2. Historic Market Data & Future Forecasts, By Segment 1, 2024-2033
6.3.6.3. Historic Market Data & Future Forecasts, By Segment 2, 2024-2033

6.4. Asia Pacific
6.4.1. Historic Market Data & Future Forecasts, 2024-2033
6.4.2. Historic Market Data & Future Forecasts, By Segment 1, 2024-2033
6.4.3. Historic Market Data & Future Forecasts, By Segment 2, 2024-2033

6.4.4. China
6.4.4.1. Historic Market Data & Future Forecasts, 2024-2033
6.4.4.2. Historic Market Data & Future Forecasts, By Segment 1, 2024-2033
6.4.4.3. Historic Market Data & Future Forecasts, By Segment 2, 2024-2033

6.4.5. India
6.4.5.1. Historic Market Data & Future Forecasts, 2024-2033
6.4.5.2. Historic Market Data & Future Forecasts, By Segment 1, 2024-2033
6.4.5.3. Historic Market Data & Future Forecasts, By Segment 2, 2024-2033

6.4.6. Japan
6.4.6.1. Historic Market Data & Future Forecasts, 2024-2033
6.4.6.2. Historic Market Data & Future Forecasts, By Segment 1, 2024-2033
6.4.6.3. Historic Market Data & Future Forecasts, By Segment 2, 2024-2033

6.4.7. South Korea
6.4.7.1. Historic Market Data & Future Forecasts, 2024-2033
6.4.7.2. Historic Market Data & Future Forecasts, By Segment 1, 2024-2033
6.4.7.3. Historic Market Data & Future Forecasts, By Segment 2, 2024-2033

6.5. Latin America
6.5.1. Historic Market Data & Future Forecasts, 2024-2033
6.5.2. Historic Market Data & Future Forecasts, By Segment 1, 2024-2033
6.5.3. Historic Market Data & Future Forecasts, By Segment 2, 2024-2033

6.5.4. Brazil
6.5.4.1. Historic Market Data & Future Forecasts, 2024-2033
6.5.4.2. Historic Market Data & Future Forecasts, By Segment 1, 2024-2033
6.5.4.3. Historic Market Data & Future Forecasts, By Segment 2, 2024-2033

6.5.5. Mexico
6.5.5.1. Historic Market Data & Future Forecasts, 2024-2033
6.5.5.2. Historic Market Data & Future Forecasts, By Segment 1, 2024-2033
6.5.5.3. Historic Market Data & Future Forecasts, By Segment 2, 2024-2033

6.6. Middle East & Africa
6.6.1. Historic Market Data & Future Forecasts, 2024-2033
6.6.2. Historic Market Data & Future Forecasts, By Segment 1, 2024-2033
6.6.3. Historic Market Data & Future Forecasts, By Segment 2, 2024-2033

6.6.4. UAE
6.6.4.1. Historic Market Data & Future Forecasts, 2024-2033
6.6.4.2. Historic Market Data & Future Forecasts, By Segment 1, 2024-2033
6.6.4.3. Historic Market Data & Future Forecasts, By Segment 2, 2024-2033

6.6.5. Saudi Arabia
6.6.5.1. Historic Market Data & Future Forecasts, 2024-2033
6.6.5.2. Historic Market Data & Future Forecasts, By Segment 1, 2024-2033
6.6.5.3. Historic Market Data & Future Forecasts, By Segment 2, 2024-2033

6.6.6. South Africa
6.6.6.1. Historic Market Data & Future Forecasts, 2024-2033
6.6.6.2. Historic Market Data & Future Forecasts, By Segment 1, 2024-2033
6.6.6.3. Historic Market Data & Future Forecasts, By Segment 2, 2024-2033

Chapter 7. Competitive Landscape

7.1. Competitive Heatmap Analysis, 2023
7.2. Competitive Product Analysis

7.3. Company 1
7.3.1. Company Description
7.3.2. Financial Highlights
7.3.3. Product Portfolio
7.3.4. Strategic Initiatives

7.4. Company 2
7.4.1. Company Description
7.4.2. Financial Highlights
7.4.3. Product Portfolio
7.4.4. Strategic Initiatives

7.5. Company 3
7.5.1. Company Description
7.5.2. Financial Highlights
7.5.3. Product Portfolio
7.5.4. Strategic Initiatives

7.6. Company 4
7.6.1. Company Description
7.6.2. Financial Highlights
7.6.3. Product Portfolio
7.6.4. Strategic Initiatives

7.7. Company 5
7.7.1. Company Description
7.7.2. Financial Highlights
7.7.3. Product Portfolio
7.7.4. Strategic Initiatives

7.8. Company 6
7.8.1. Company Description
7.8.2. Financial Highlights
7.8.3. Product Portfolio
7.8.4. Strategic Initiatives

7.9. Company 7
7.9.1. Company Description
7.9.2. Financial Highlights
7.9.3. Product Portfolio
7.9.4. Strategic Initiatives

7.10. Company 8
7.10.1. Company Description
7.10.2. Financial Highlights
7.10.3. Product Portfolio
7.10.4. Strategic Initiatives

7.11. Company 9
7.11.1. Company Description
7.11.2. Financial Highlights
7.11.3. Product Portfolio
7.11.4. Strategic Initiatives

7.12. Company 10
7.12.1. Company Description
7.12.2. Financial Highlights
7.12.3. Product Portfolio
7.12.4. Strategic Initiatives

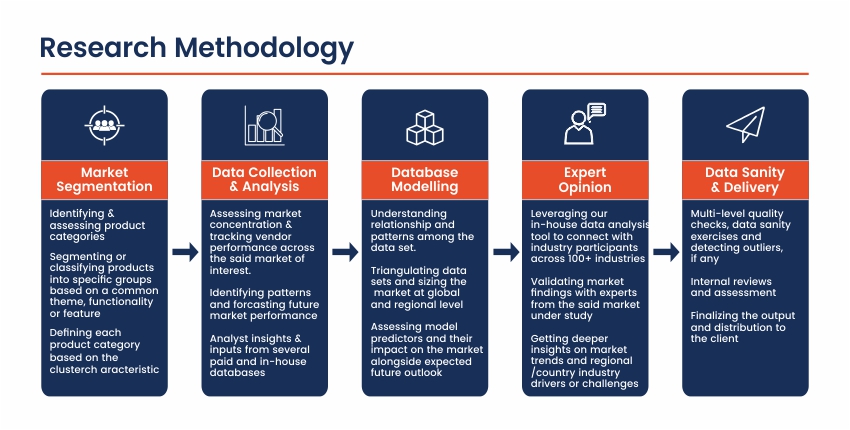
Research Methodology

Frequently Asked Questions About This Report

Choose License Type

$2,430
$2,970
$3,510

Our salient features

Best Solution

We will assist you in comprehending the value propositions of various reports across multiple domains and recommend the optimal solution to meet your research requirements.

Customized Research

Our team of analysts and consultants provide assistance for customized research requirements

Max ROI

Guaranteed maximum assistance to help you get your reports at the optimum prices, thereby ensuring maximum returns on investment.

24/7 Support

24X7 availability to help you through the buying process as well as answer any of your doubts.

Get a free sample report

This free sample study provides a comprehensive overview of the report, including an executive summary, market segments, complete analysis, country-level analysis, and more.

Our Clients

We've Received Your Request

We Thank You for filling out your requirements. Our sales team will get in touch with you shortly.