European Fuel Card Market Size, Share, Growth, Trends, Statistics Analysis Report and By Segment Forecasts 2024 to 2033

Market Overview

The European fuel card market is a rapidly evolving sector, significantly influenced by the region’s economic activities, technological advancements, and regulatory environment. Fuel cards, also known as fleet cards, are used by businesses to manage expenses related to fuel purchases and vehicle maintenance. These cards offer numerous benefits such as detailed reporting, simplified accounting, fraud prevention, and cashless transactions. The market has seen substantial growth due to the increasing number of commercial fleets, the need for efficient fuel management solutions, and the adoption of digital payment technologies. Companies operating in logistics, transportation, and delivery services are the primary users of fuel cards, leveraging them to streamline operations and reduce costs. The market is also witnessing innovation in terms of telematics integration, mobile payment solutions, and enhanced data analytics, providing businesses with comprehensive tools to monitor and optimize their fleet performance.
Key Takeaways of the Market

  • Growth driven by the expanding logistics and transportation sectors.
  • Increasing adoption of digital payment technologies.
  • Enhanced fraud prevention and security features.
  • Integration with telematics and data analytics for fleet management.
  • Rising demand for cashless transactions and simplified expense management.
  • Market segmentation based on card type, application, and end-user industry.
  • Significant regional variations influenced by economic conditions and regulatory policies.

Market Driver

One of the primary drivers of the European fuel card market is the growing number of commercial fleets across the continent. With the rise of e-commerce and global trade, there is a significant increase in the demand for logistics and transportation services. This surge in commercial fleet operations necessitates efficient fuel management solutions to control costs and enhance operational efficiency. Fuel cards provide an ideal solution by offering detailed transaction reports, real-time monitoring of fuel expenses, and streamlined billing processes. Additionally, they help in mitigating fraud and unauthorized fuel purchases, ensuring that businesses can maintain tight control over their fuel expenditures.

Technological advancements also play a crucial role in driving the market. The integration of fuel cards with telematics systems allows fleet managers to gain insights into vehicle performance, driver behavior, and route optimization. These integrated solutions enable businesses to make data-driven decisions, improving overall fleet efficiency and reducing fuel consumption. Moreover, the advent of mobile payment solutions and contactless transactions has further propelled the adoption of fuel cards, providing convenience and security to users.

The regulatory environment in Europe also supports the growth of the fuel card market. Governments are implementing stringent emission norms and promoting the use of alternative fuels, driving the need for advanced fuel management systems. Fuel cards equipped with data analytics capabilities help businesses comply with these regulations by tracking fuel usage and emissions, thereby contributing to environmental sustainability.

Market Restraint

Despite the numerous benefits and growing adoption, the European fuel card market faces several challenges that could hinder its growth. One significant restraint is the high cost associated with fuel card services. Many providers charge fees for card issuance, transactions, and additional services such as detailed reporting and telematics integration. These costs can add up, particularly for small and medium-sized enterprises (SMEs) with limited budgets. Consequently, some businesses may be reluctant to adopt fuel cards due to the perceived financial burden.

Another challenge is the complexity of managing multiple fuel cards, especially for businesses with large fleets operating across different regions. Each fuel card provider may have varying acceptance networks, transaction fees, and reporting formats, making it difficult for fleet managers to consolidate data and manage expenses effectively. This fragmentation can lead to inefficiencies and increased administrative overhead.

Moreover, the market is subject to regulatory uncertainties and economic fluctuations. Changes in fuel prices, tax policies, and environmental regulations can significantly impact the operational costs and profitability of businesses using fuel cards. Economic downturns or political instability in certain regions may also affect the demand for transportation and logistics services, thereby influencing the fuel card market dynamics.

Market Opportunity

The European fuel card market presents several opportunities for growth and innovation, driven by evolving business needs and technological advancements. One of the most promising opportunities lies in the expansion of fuel card services to include electric vehicle (EV) charging. With the increasing adoption of electric vehicles across Europe, there is a growing demand for efficient and integrated payment solutions for EV charging. Fuel card providers can capitalize on this trend by offering hybrid cards that support both traditional fuel and EV charging payments, providing businesses with a comprehensive solution for managing their diverse fleets.

Another significant opportunity is the development of advanced data analytics and telematics solutions. By leveraging big data and artificial intelligence, fuel card providers can offer enhanced analytics capabilities that provide deeper insights into fuel consumption patterns, vehicle performance, and driver behavior. These insights can help businesses optimize their operations, reduce fuel costs, and improve overall fleet efficiency. Additionally, predictive analytics can be used to forecast fuel needs and maintenance requirements, enabling proactive management of fleet resources.

The growing focus on sustainability and environmental responsibility also opens up new avenues for market growth. Fuel card providers can introduce features that track and report on carbon emissions, helping businesses monitor their environmental impact and comply with green regulations. Furthermore, partnerships with renewable fuel suppliers and the promotion of alternative fuels can enhance the appeal of fuel cards to environmentally conscious businesses.

Market Segment Analysis

Segmentation by Card Type

The European fuel card market can be segmented based on card type into universal fuel cards, branded fuel cards, and merchant fuel cards. Universal fuel cards are widely accepted at various fuel stations across different brands, providing flexibility and convenience to users. These cards are particularly beneficial for businesses with fleets operating in multiple regions, as they ensure broad acceptance and simplify expense management. Universal fuel cards often come with additional features such as detailed reporting, fraud prevention, and integration with telematics systems.

Branded fuel cards, on the other hand, are issued by specific fuel companies and are typically accepted only at the brand’s fuel stations. These cards offer benefits such as loyalty rewards, discounts, and tailored services to users who prefer a specific fuel provider. Branded fuel cards are popular among businesses that have a strong preference for a particular fuel brand or operate in areas where the brand has a significant presence.

Merchant fuel cards are issued by third-party providers and are accepted at a network of partner fuel stations. These cards offer a balance between the flexibility of universal cards and the loyalty benefits of branded cards. Merchant fuel cards are suitable for businesses looking for a cost-effective solution with a reasonable acceptance network and additional services such as reporting and expense management.

Segmentation by End-User Industry

The market can also be segmented based on end-user industry, including transportation and logistics, construction, agriculture, and retail. The transportation and logistics sector is the largest user of fuel cards, driven by the need for efficient fuel management and cost control in fleet operations. Fuel cards provide transportation companies with detailed insights into fuel consumption, enabling them to optimize routes, monitor driver behavior, and reduce fuel expenses.

The construction industry also relies heavily on fuel cards to manage the fuel needs of their vehicles and equipment. With numerous vehicles and machinery operating on construction sites, fuel cards help in tracking fuel usage, preventing unauthorized purchases, and simplifying expense reporting. The ability to manage fuel costs effectively is crucial for construction companies to maintain profitability and project timelines.

In the agriculture sector, fuel cards are used to monitor and manage the fuel consumption of farming equipment and vehicles. The seasonal nature of agricultural activities requires efficient fuel management to ensure operations run smoothly during peak periods. Fuel cards offer farmers the convenience of cashless transactions, detailed reporting, and control over fuel expenses.

The retail industry uses fuel cards for delivery and logistics operations, particularly for businesses involved in e-commerce and home deliveries. Fuel cards help retail companies streamline their delivery processes, manage fuel costs, and ensure timely deliveries to customers. The ability to track and control fuel expenses is vital for retail businesses to maintain competitive pricing and customer satisfaction.

Regional Analysis

The European fuel card market exhibits significant regional variations, influenced by factors such as economic conditions, regulatory environment, and market maturity. Western Europe, including countries such as Germany, the UK, and France, dominates the market due to its advanced infrastructure, high adoption of digital payment technologies, and strong regulatory frameworks. These countries have well-developed transportation and logistics sectors, driving the demand for efficient fuel management solutions. The presence of major fuel card providers and the widespread acceptance of fuel cards further support market growth in this region.

In Germany, for instance, the fuel card market is driven by the country’s robust automotive industry and extensive network of fuel stations. The adoption of telematics and digital payment solutions is high, providing businesses with advanced tools for fleet management and expense control. Similarly, the UK has a well-established fuel card market, supported by a mature transportation sector and stringent environmental regulations. The demand for fuel cards in the UK is driven by the need for efficient fuel management, compliance with emission standards, and the convenience of cashless transactions.

Northern Europe, including countries such as Sweden, Denmark, and Norway, also presents significant growth opportunities for the fuel card market. The region’s focus on sustainability and green technologies aligns with the adoption of fuel cards, particularly those that support alternative fuels and EV charging. Northern Europe is known for its high standards of living and environmental consciousness, driving demand for innovative and eco-friendly fuel management solutions. The market in this region is characterized by a high level of technological adoption and a strong emphasis on reducing carbon emissions.

Eastern Europe, including countries such as Poland, Czech Republic, and Hungary, is an emerging market for fuel cards. The region’s growing transportation and logistics sector, coupled with increasing economic activities, is driving the demand for efficient fuel management solutions. While the market in Eastern Europe is still developing, the availability of affordable fuel card services and the increasing awareness of their benefits are contributing to market growth. The region’s relatively lower adoption of digital payment technologies presents an opportunity for fuel card providers to expand their presence and educate businesses on the advantages of fuel cards.

Southern Europe, including countries such as Italy, Spain, and Portugal, presents a mixed market scenario. While the region’s economic conditions and regulatory environment vary, there is a growing awareness of the need for efficient fuel management solutions.

Competitive Analysis

The European fuel card market is characterized by intense competition among key players striving to expand their market share and enhance their service offerings. Major players such as BP, Shell, Total, and Esso dominate the market with their extensive network of fuel stations and comprehensive range of fuel card services. These companies offer universal fuel cards accepted at a wide range of fuel stations across Europe, providing businesses with convenience and flexibility in managing their fuel expenses. Additionally, they provide value-added services such as detailed reporting, telematics integration, and loyalty rewards programs to attract and retain customers.

In addition to oil and gas companies, there are several independent fuel card providers operating in the market, catering to specific niche segments or offering tailored solutions to meet the unique needs of businesses. Companies such as WEX Europe Services, EuroShell Fuel Card, and UTA specialize in providing fuel card services to fleet operators, offering customizable solutions, competitive pricing, and dedicated customer support. These independent providers often differentiate themselves through innovative features, such as mobile payment apps, online account management portals, and value-added services such as insurance and roadside assistance.

The market also includes fintech companies and payment service providers entering the fuel card space, leveraging digital technologies and data analytics to offer seamless and integrated fuel management solutions. Companies such as Edenred, Fleetcor, and Allstar Business Solutions are expanding their presence in the market by offering innovative payment solutions, mobile apps, and telematics integration features. Their focus on user experience, convenience, and value-added services is reshaping the competitive landscape of the fuel card market, driving incumbents to innovate and differentiate their offerings.

Overall, the competitive dynamics of the European fuel card market are driven by factors such as network coverage, service offerings, pricing, customer support, and technological innovation. Market players are continuously evolving their strategies to stay ahead in the rapidly changing market landscape, focusing on enhancing customer experience, expanding their service portfolios, and strengthening their partnerships and alliances within the ecosystem.

Key Industry Developments

  • Introduction of mobile payment apps and contactless payment solutions by fuel card providers, enhancing convenience and security for users.
  • Integration of fuel cards with telematics systems and GPS tracking devices, enabling real-time monitoring of fleet performance and fuel consumption.
  • Expansion of loyalty rewards programs and partnership initiatives to incentivize fuel card usage and enhance customer engagement.
  • Development of eco-friendly fuel card solutions that promote alternative fuels, electric vehicle charging, and carbon offsetting initiatives.
  • Launch of digital platforms and online portals for account management, reporting, and expense tracking, providing businesses with greater visibility and control over their fuel expenses.
  • Adoption of blockchain technology to enhance transparency, security, and efficiency in fuel card transactions and data management.
  • Collaboration between fuel card providers, fuel stations, and vehicle manufacturers to offer integrated solutions that optimize fuel efficiency, reduce emissions, and improve overall fleet management practices.

Future Outlook

The future outlook for the European fuel card market is promising, driven by factors such as technological innovation, regulatory developments, and evolving customer needs. The market is expected to witness continued growth as businesses increasingly recognize the benefits of fuel cards in streamlining operations, controlling costs, and enhancing fleet management efficiency. The integration of fuel cards with advanced technologies such as telematics, data analytics, and mobile payments will further enhance their value proposition, providing businesses with actionable insights and real-time control over their fuel expenses.

The adoption of electric vehicles and alternative fuels is expected to reshape the fuel card market, driving demand for solutions that support EV charging and green initiatives. Fuel card providers are likely to expand their service offerings to include EV charging networks, renewable energy credits, and carbon offset programs, catering to the growing sustainability requirements of businesses. Additionally, the shift towards digital payments and contactless transactions will accelerate, fueled by changing consumer preferences and advancements in payment technologies.

Regulatory developments, including emission standards, tax policies, and data privacy regulations, will continue to influence the market dynamics and shape industry trends. Fuel card providers will need to adapt to evolving regulatory requirements, ensuring compliance while delivering value-added services to their customers. Moreover, partnerships and collaborations within the ecosystem will play a crucial role in driving innovation and expanding market reach, as fuel card providers seek to leverage synergies and offer integrated solutions that meet the diverse needs of businesses across different sectors and regions.

Overall, the European fuel card market is poised for sustained growth and innovation, driven by the ongoing digital transformation, environmental considerations, and evolving customer expectations. Market players that can anticipate and respond effectively to these trends will be well-positioned to capitalize on the opportunities and maintain their competitive edge in the dynamic fuel card landscape.

Market Segmentation

  • By Card Type
    • Universal Fuel Cards
    • Branded Fuel Cards
    • Merchant Fuel Cards
  • By End-User Industry
    • Transportation and Logistics
    • Construction
    • Agriculture
    • Retail
    • Others

Table of Contents

Chapter 1. Research Methodology & Data Sources

1.1. Data Analysis Models
1.2. Research Scope & Assumptions
1.3. List of Primary & Secondary Data Sources 

Chapter 2. Executive Summary

2.1. Market Overview
2.2. Segment Overview
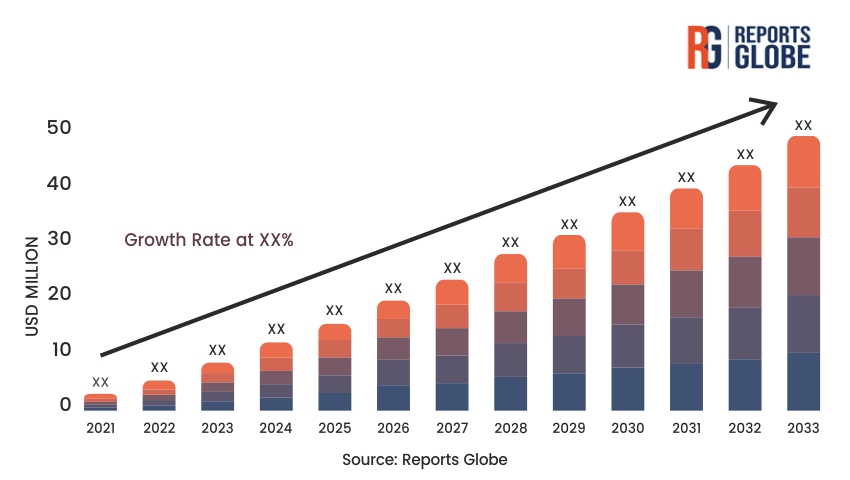
2.3. Market Size and Estimates, 2021 to 2033
2.4. Market Size and Estimates, By Segments, 2021 to 2033

Chapter 3. Industry Analysis

3.1. Market Segmentation
3.2. Market Definitions and Assumptions
3.3. Supply chain analysis
3.4. Porter’s five forces analysis
3.5. PEST analysis
3.6. Market Dynamics
3.6.1. Market Driver Analysis
3.6.2. Market Restraint analysis
3.6.3. Market Opportunity Analysis
3.7. Competitive Positioning Analysis, 2023
3.8. Key Player Ranking, 2023

Chapter 4. Market Segment Analysis- Segment 1

4.1.1. Historic Market Data & Future Forecasts, 2024-2033
4.1.2. Historic Market Data & Future Forecasts by Region, 2024-2033

Chapter 5. Market Segment Analysis- Segment 2

5.1.1. Historic Market Data & Future Forecasts, 2024-2033
5.1.2. Historic Market Data & Future Forecasts by Region, 2024-2033

Chapter 6. Regional or Country Market Insights

** Reports focusing on a particular region or country will contain data unique to that region or country **

6.1. Global Market Data & Future Forecasts, By Region 2024-2033

6.2. North America
6.2.1. Historic Market Data & Future Forecasts, 2024-2033
6.2.2. Historic Market Data & Future Forecasts, By Segment 1, 2024-2033
6.2.3. Historic Market Data & Future Forecasts, By Segment 2, 2024-2033

6.2.4. U.S.
6.2.4.1. Historic Market Data & Future Forecasts, 2024-2033
6.2.4.2. Historic Market Data & Future Forecasts, By Segment 1, 2024-2033
6.2.4.3. Historic Market Data & Future Forecasts, By Segment 2, 2024-2033

6.2.5. Canada
6.2.5.1. Historic Market Data & Future Forecasts, 2024-2033
6.2.5.2. Historic Market Data & Future Forecasts, By Segment 1, 2024-2033
6.2.5.3. Historic Market Data & Future Forecasts, By Segment 2, 2024-2033

6.3. Europe
6.3.1. Historic Market Data & Future Forecasts, 2024-2033
6.3.2. Historic Market Data & Future Forecasts, By Segment 1, 2024-2033
6.3.3. Historic Market Data & Future Forecasts, By Segment 2, 2024-2033

6.3.4. UK
6.3.4.1. Historic Market Data & Future Forecasts, 2024-2033
6.3.4.2. Historic Market Data & Future Forecasts, By Segment 1, 2024-2033
6.3.4.3. Historic Market Data & Future Forecasts, By Segment 2, 2024-2033

6.3.5. Germany
6.3.5.1. Historic Market Data & Future Forecasts, 2024-2033
6.3.5.2. Historic Market Data & Future Forecasts, By Segment 1, 2024-2033
6.3.5.3. Historic Market Data & Future Forecasts, By Segment 2, 2024-2033

6.3.6. France
6.3.6.1. Historic Market Data & Future Forecasts, 2024-2033
6.3.6.2. Historic Market Data & Future Forecasts, By Segment 1, 2024-2033
6.3.6.3. Historic Market Data & Future Forecasts, By Segment 2, 2024-2033

6.4. Asia Pacific
6.4.1. Historic Market Data & Future Forecasts, 2024-2033
6.4.2. Historic Market Data & Future Forecasts, By Segment 1, 2024-2033
6.4.3. Historic Market Data & Future Forecasts, By Segment 2, 2024-2033

6.4.4. China
6.4.4.1. Historic Market Data & Future Forecasts, 2024-2033
6.4.4.2. Historic Market Data & Future Forecasts, By Segment 1, 2024-2033
6.4.4.3. Historic Market Data & Future Forecasts, By Segment 2, 2024-2033

6.4.5. India
6.4.5.1. Historic Market Data & Future Forecasts, 2024-2033
6.4.5.2. Historic Market Data & Future Forecasts, By Segment 1, 2024-2033
6.4.5.3. Historic Market Data & Future Forecasts, By Segment 2, 2024-2033

6.4.6. Japan
6.4.6.1. Historic Market Data & Future Forecasts, 2024-2033
6.4.6.2. Historic Market Data & Future Forecasts, By Segment 1, 2024-2033
6.4.6.3. Historic Market Data & Future Forecasts, By Segment 2, 2024-2033

6.4.7. South Korea
6.4.7.1. Historic Market Data & Future Forecasts, 2024-2033
6.4.7.2. Historic Market Data & Future Forecasts, By Segment 1, 2024-2033
6.4.7.3. Historic Market Data & Future Forecasts, By Segment 2, 2024-2033

6.5. Latin America
6.5.1. Historic Market Data & Future Forecasts, 2024-2033
6.5.2. Historic Market Data & Future Forecasts, By Segment 1, 2024-2033
6.5.3. Historic Market Data & Future Forecasts, By Segment 2, 2024-2033

6.5.4. Brazil
6.5.4.1. Historic Market Data & Future Forecasts, 2024-2033
6.5.4.2. Historic Market Data & Future Forecasts, By Segment 1, 2024-2033
6.5.4.3. Historic Market Data & Future Forecasts, By Segment 2, 2024-2033

6.5.5. Mexico
6.5.5.1. Historic Market Data & Future Forecasts, 2024-2033
6.5.5.2. Historic Market Data & Future Forecasts, By Segment 1, 2024-2033
6.5.5.3. Historic Market Data & Future Forecasts, By Segment 2, 2024-2033

6.6. Middle East & Africa
6.6.1. Historic Market Data & Future Forecasts, 2024-2033
6.6.2. Historic Market Data & Future Forecasts, By Segment 1, 2024-2033
6.6.3. Historic Market Data & Future Forecasts, By Segment 2, 2024-2033

6.6.4. UAE
6.6.4.1. Historic Market Data & Future Forecasts, 2024-2033
6.6.4.2. Historic Market Data & Future Forecasts, By Segment 1, 2024-2033
6.6.4.3. Historic Market Data & Future Forecasts, By Segment 2, 2024-2033

6.6.5. Saudi Arabia
6.6.5.1. Historic Market Data & Future Forecasts, 2024-2033
6.6.5.2. Historic Market Data & Future Forecasts, By Segment 1, 2024-2033
6.6.5.3. Historic Market Data & Future Forecasts, By Segment 2, 2024-2033

6.6.6. South Africa
6.6.6.1. Historic Market Data & Future Forecasts, 2024-2033
6.6.6.2. Historic Market Data & Future Forecasts, By Segment 1, 2024-2033
6.6.6.3. Historic Market Data & Future Forecasts, By Segment 2, 2024-2033

Chapter 7. Competitive Landscape

7.1. Competitive Heatmap Analysis, 2023
7.2. Competitive Product Analysis

7.3. Company 1
7.3.1. Company Description
7.3.2. Financial Highlights
7.3.3. Product Portfolio
7.3.4. Strategic Initiatives

7.4. Company 2
7.4.1. Company Description
7.4.2. Financial Highlights
7.4.3. Product Portfolio
7.4.4. Strategic Initiatives

7.5. Company 3
7.5.1. Company Description
7.5.2. Financial Highlights
7.5.3. Product Portfolio
7.5.4. Strategic Initiatives

7.6. Company 4
7.6.1. Company Description
7.6.2. Financial Highlights
7.6.3. Product Portfolio
7.6.4. Strategic Initiatives

7.7. Company 5
7.7.1. Company Description
7.7.2. Financial Highlights
7.7.3. Product Portfolio
7.7.4. Strategic Initiatives

7.8. Company 6
7.8.1. Company Description
7.8.2. Financial Highlights
7.8.3. Product Portfolio
7.8.4. Strategic Initiatives

7.9. Company 7
7.9.1. Company Description
7.9.2. Financial Highlights
7.9.3. Product Portfolio
7.9.4. Strategic Initiatives

7.10. Company 8
7.10.1. Company Description
7.10.2. Financial Highlights
7.10.3. Product Portfolio
7.10.4. Strategic Initiatives

7.11. Company 9
7.11.1. Company Description
7.11.2. Financial Highlights
7.11.3. Product Portfolio
7.11.4. Strategic Initiatives

7.12. Company 10
7.12.1. Company Description
7.12.2. Financial Highlights
7.12.3. Product Portfolio
7.12.4. Strategic Initiatives

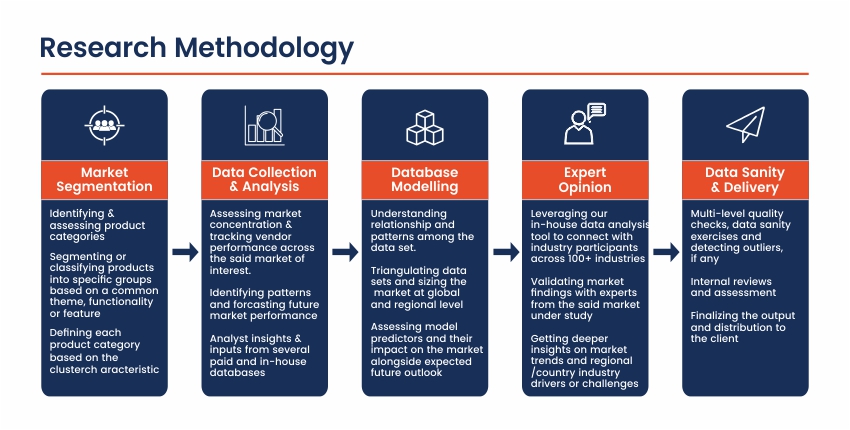
Research Methodology

Frequently Asked Questions About This Report

Choose License Type

$2,430
$2,970
$3,510

Our salient features

Best Solution

We will assist you in comprehending the value propositions of various reports across multiple domains and recommend the optimal solution to meet your research requirements.

Customized Research

Our team of analysts and consultants provide assistance for customized research requirements

Max ROI

Guaranteed maximum assistance to help you get your reports at the optimum prices, thereby ensuring maximum returns on investment.

24/7 Support

24X7 availability to help you through the buying process as well as answer any of your doubts.

Get a free sample report

This free sample study provides a comprehensive overview of the report, including an executive summary, market segments, complete analysis, country-level analysis, and more.

Our Clients

We've Received Your Request

We Thank You for filling out your requirements. Our sales team will get in touch with you shortly.