U.S. Oil And Gas Infrastructure Market Size, Share, Growth, Trends, Statistics Analysis Report and By Segment Forecasts 2024 to 2033

Market Overview

The US oil and gas infrastructure market is a critical component of the nation’s energy sector, encompassing a vast network of pipelines, storage facilities, processing plants, and distribution systems. This infrastructure forms the backbone of America’s energy supply chain, facilitating the extraction, transportation, and delivery of oil and natural gas resources across the country. The market has undergone significant transformations in recent years, driven by technological advancements, changing energy policies, and fluctuating global demand.

The United States has emerged as a global leader in oil and gas production, largely due to the shale revolution and advancements in hydraulic fracturing and horizontal drilling technologies. This surge in domestic production has necessitated substantial investments in infrastructure to support the increased output and changing distribution patterns. The market has seen a shift from import-oriented infrastructure to export-focused facilities, particularly in the liquefied natural gas (LNG) sector.

As the energy landscape evolves, the oil and gas infrastructure market is facing both opportunities and challenges. On one hand, the continued reliance on fossil fuels in many sectors of the economy ensures ongoing demand for traditional infrastructure. On the other hand, the push for decarbonization and the growth of renewable energy sources are prompting companies to rethink their long-term infrastructure strategies. This has led to increased interest in developing infrastructure that can support both conventional and alternative energy sources, such as hydrogen-ready pipelines or facilities that can handle biofuels.
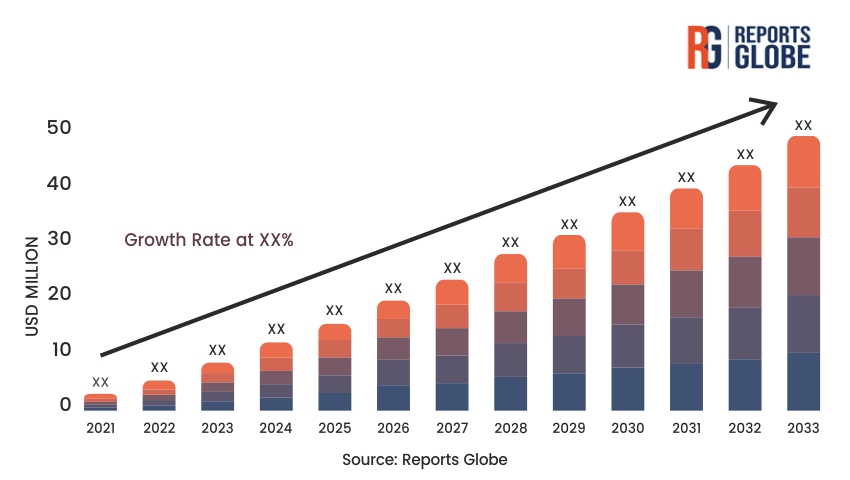
Key Takeaways of the market

  • The US oil and gas infrastructure market is undergoing significant transformation due to the shale revolution and changing global energy dynamics.
  • Investments in export-oriented infrastructure, particularly LNG facilities, have increased to capitalize on the US’s position as a major energy exporter.
  • Midstream infrastructure remains critical for connecting production sites with end-users and maintaining market efficiency.
  • Environmental concerns and regulatory pressures are driving investments in cleaner technologies and infrastructure upgrades.
  • Digital transformation and automation are becoming increasingly important for improving operational efficiency and safety.
  • Geopolitical factors are influencing infrastructure development and investment decisions.
  • The integration of renewable energy sources with existing oil and gas infrastructure is becoming more prevalent.
  • There is a growing trend towards repurposing existing infrastructure for new uses in the evolving energy landscape.

Market Driver

The US oil and gas infrastructure market is propelled by several key drivers that continue to shape its growth and evolution. One of the primary drivers is the sustained increase in domestic oil and gas production, particularly from shale formations. The shale revolution has transformed the United States into a net energy exporter, necessitating significant investments in infrastructure to support the transportation, processing, and export of these resources. This shift has led to a boom in pipeline construction, expansion of storage facilities, and development of export terminals, especially for liquefied natural gas (LNG).

Another crucial driver is the ongoing need for infrastructure modernization and replacement. Much of the existing oil and gas infrastructure in the United States is aging, with some pipelines and facilities dating back several decades. This aging infrastructure presents safety and efficiency concerns, driving investments in maintenance, upgrades, and replacements. The push for modernization is further fueled by the adoption of advanced technologies, such as smart sensors, artificial intelligence, and predictive maintenance systems, which promise to enhance operational efficiency, reduce downtime, and improve safety standards across the industry.

Lastly, the digitalization of the energy sector is driving investments in smart infrastructure and data management systems. Companies are increasingly recognizing the value of real-time data and analytics in optimizing operations, improving maintenance schedules, and enhancing overall asset performance. This is leading to investments in advanced sensors, Internet of Things (IoT) devices, and sophisticated control systems across the oil and gas infrastructure landscape.

Market Restraint

Despite the numerous drivers propelling the US oil and gas infrastructure market, several significant restraints pose challenges to its growth and development. One of the most prominent restraints is the increasing environmental scrutiny and opposition to fossil fuel infrastructure projects. Public concern over climate change and environmental impacts has led to growing resistance against new pipeline projects, LNG terminals, and other oil and gas facilities. This opposition often results in lengthy legal battles, project delays, and in some cases, cancellations, significantly impacting the pace of infrastructure development and increasing project costs.

Lastly, the physical impacts of climate change pose a growing restraint on infrastructure development and operation. Increased frequency and severity of extreme weather events, rising sea levels, and changing temperature patterns can affect the reliability and safety of oil and gas infrastructure, necessitating additional investments in resilience measures and potentially limiting the viable locations for new infrastructure projects.

Market Opportunity

The US oil and gas infrastructure market, despite facing various challenges, presents significant opportunities for growth and innovation. One of the most promising opportunities lies in the development of infrastructure to support the growing liquefied natural gas (LNG) export market. As global demand for cleaner energy sources increases, particularly in Asia and Europe, the United States is well-positioned to become a major LNG exporter. This trend is driving investments in LNG liquefaction plants, export terminals, and associated pipeline infrastructure, creating substantial opportunities for companies across the value chain.

Another key opportunity is the integration of digital technologies and automation into existing and new infrastructure. The concept of “smart infrastructure” is gaining traction, with the potential to revolutionize how oil and gas assets are operated and maintained. Advanced sensors, Internet of Things (IoT) devices, artificial intelligence, and machine learning algorithms can enhance operational efficiency, reduce downtime, and improve safety. Companies that can effectively implement these technologies stand to gain a significant competitive advantage in the market.

Lastly, the growing interconnectedness of global energy markets is creating opportunities for companies to expand their international presence. US firms with expertise in developing and operating advanced oil and gas infrastructure can leverage their knowledge and experience to pursue projects in emerging markets, particularly in regions looking to develop their own energy resources or transition to cleaner fuels.

Market Segment Analysis

Pipeline Infrastructure Segment: The pipeline infrastructure segment is a critical component of the US oil and gas market, serving as the primary means of transporting crude oil, natural gas, and refined products across the country. This segment has seen significant growth and transformation in recent years, driven by the shale boom and changing energy flow patterns. The US boasts an extensive network of pipelines, including gathering lines, transmission pipelines, and distribution systems, spanning hundreds of thousands of miles.

One of the key trends in this segment is the ongoing expansion and reconfiguration of pipeline networks to accommodate new production areas and market demands. For instance, there has been substantial investment in pipeline infrastructure connecting the Permian Basin to Gulf Coast export facilities, reflecting the shift from import-dependent to export-oriented energy flows. The segment has also witnessed innovations in pipeline materials and construction techniques, aimed at improving safety, reducing environmental impact, and enhancing operational efficiency.

Moreover, the pipeline segment is at the forefront of efforts to reduce methane emissions from the oil and gas sector. Companies are investing in advanced leak detection and repair technologies, as well as implementing more rigorous monitoring and maintenance programs. This focus on emissions reduction not only addresses environmental concerns but also improves operational efficiency by minimizing product loss.

The integration of digital technologies is transforming pipeline operations and maintenance. Smart pigging devices, equipped with sensors and data collection capabilities, are being used to assess pipeline integrity and identify potential issues before they escalate. Real-time monitoring systems and predictive analytics are enhancing pipeline operators’ ability to optimize flow rates, detect anomalies, and respond quickly to potential threats.

Storage Infrastructure Segment: The storage infrastructure segment plays a vital role in balancing supply and demand fluctuations in the oil and gas market. This segment encompasses various types of storage facilities, including underground natural gas storage, aboveground oil tanks, and strategic petroleum reserves. The importance of storage infrastructure has been underscored by recent market volatility, including the negative oil price event in 2020, which highlighted the critical role of storage in managing oversupply situations.

The storage segment has seen growing interest in expanding capacity, particularly for natural gas storage to support the increasing role of gas in power generation and exports. There is also a trend towards developing more flexible and responsive storage solutions that can quickly adapt to market changes. Advanced monitoring and control systems are being implemented to improve inventory management and operational efficiency.

The strategic petroleum reserve (SPR) infrastructure is also undergoing modernization efforts to enhance its flexibility and responsiveness to market disruptions. This includes investments in improved drawdown capabilities and potential expansion of storage capacity in strategic locations.

The storage segment is also seeing increased integration with digital technologies. Advanced sensors, data analytics, and artificial intelligence are being employed to optimize storage operations, improve inventory management, and enhance safety measures. These technologies enable real-time monitoring of storage conditions, predictive maintenance, and more efficient utilization of storage capacity.

Regional Analysis

The US oil and gas infrastructure market exhibits significant regional variations, reflecting the diverse geological, economic, and regulatory landscapes across the country. The Gulf Coast region, encompassing states like Texas and Louisiana, remains the heart of the US oil and gas infrastructure, boasting a dense network of pipelines, refineries, and export terminals. This region has seen substantial investments in recent years, particularly in LNG export facilities and petrochemical plants, capitalizing on abundant shale gas resources and strategic coastal locations.

The Permian Basin, spanning parts of Texas and New Mexico, has emerged as a critical focus area for infrastructure development. The region’s booming oil and gas production has driven significant investments in gathering systems, processing plants, and long-haul pipelines to transport resources to Gulf Coast markets and export facilities. However, the rapid pace of production growth has at times outpaced infrastructure development, leading to bottlenecks and driving demand for additional midstream capacity.

Each region faces unique challenges and opportunities in infrastructure development, influenced by factors such as resource availability, environmental regulations, public sentiment, and market dynamics. The interplay between these regional differences and national energy policies continues to shape the evolution of the US oil and gas infrastructure landscape.

Competitive Analysis

The US oil and gas infrastructure market is characterized by a diverse landscape of players, ranging from large integrated energy companies to specialized infrastructure operators and service providers. The competitive dynamics of the market are shaped by factors such as geographical presence, technological capabilities, financial strength, and regulatory compliance.

Major midstream companies, such as Kinder Morgan, Enterprise Products Partners, and Energy Transfer, dominate large segments of the pipeline and storage infrastructure market. These companies leverage their extensive network of assets, operational expertise, and economies of scale to maintain competitive advantages. They continue to expand their footprint through both organic growth projects and strategic acquisitions, often focusing on key production basins and export corridors.

In the LNG infrastructure segment, companies like Cheniere Energy have established themselves as leaders, capitalizing on first-mover advantages in developing export capacity. However, this segment is becoming increasingly competitive as more players enter the market, driven by growing global demand for LNG.

As the market evolves, companies are increasingly focusing on developing integrated solutions that span multiple segments of the value chain. This trend is driving consolidation and strategic partnerships as companies seek to enhance their competitive position and offer more comprehensive services to customers.

Key Industry Developments

  • Rapid expansion of LNG export capacity along the Gulf Coast, with multiple new terminals coming online and existing facilities expanding.
  • Increased focus on carbon capture and storage (CCS) infrastructure, with several major projects announced to decarbonize oil and gas operations.
  • Growing investments in hydrogen infrastructure, including pilot projects to blend hydrogen into existing natural gas pipeline networks.
  • Adoption of advanced leak detection and repair technologies to address methane emissions from oil and gas infrastructure.
  • Development of new pipeline projects to alleviate bottlenecks in key production areas, particularly in the Permian Basin.
  • Increased scrutiny and cancellation of several high-profile pipeline projects due to environmental concerns and legal challenges.
  • Implementation of cybersecurity measures and regulations to protect critical energy infrastructure from evolving threats.
  • Expansion of natural gas storage capacity to support growing LNG exports and power generation demand.
  • Implementation of advanced materials and coatings to enhance the durability and performance of infrastructure assets.

Future Outlook

The future outlook for the US oil and gas infrastructure market is characterized by both challenges and opportunities, shaped by the ongoing energy transition, technological advancements, and evolving market dynamics. While the short to medium-term outlook remains generally positive, with continued demand for oil and gas infrastructure, the long-term perspective is more complex and uncertain.

In the coming years, the market is likely to see continued investment in infrastructure to support LNG exports, as the United States solidifies its position as a major global supplier. This will drive development of not only export terminals but also associated pipelines and processing facilities. The focus on natural gas infrastructure is expected to remain strong, given its role as a transition fuel and its importance in backing up intermittent renewable energy sources.

However, the infrastructure market will need to adapt to the changing energy landscape. There will likely be increasing emphasis on developing flexible, multi-use infrastructure that can support both traditional hydrocarbons and emerging clean energy carriers like hydrogen. The repurposing of existing assets for new uses, such as converting natural gas pipelines for hydrogen transport or adapting offshore oil platforms for wind energy support, may become more prevalent.

Lastly, the role of hydrogen in the future energy mix presents both opportunities and challenges for the oil and gas infrastructure market. As hydrogen gains traction as a clean energy carrier, there will be growing need for infrastructure to produce, transport, and store hydrogen. This could create new avenues for growth and diversification for companies in the oil and gas infrastructure sector.

Market Segmentation

  • By Infrastructure Type:
    • Pipeline Infrastructure
    • Storage Infrastructure
    • Processing Infrastructure
    • LNG Infrastructure
    • Export Terminals
    • Distribution Networks
  • By Ownership:
    • Public Infrastructure
    • Private Infrastructure
    • Public-Private Partnerships
  • By Geography:
    • Gulf Coast Region
    • Northeast Region
    • Midwest Region
    • Rocky Mountain Region
    • West Coast Region
    • Alaska and Offshore
  • By Technology Integration:
    • Conventional Infrastructure
    • Smart/Digital Infrastructure
    • Hybrid Infrastructure
  • By Regulatory Framework:
    • Federally Regulated Infrastructure
    • State-Regulated Infrastructure
    • Municipally Regulated Infrastructure
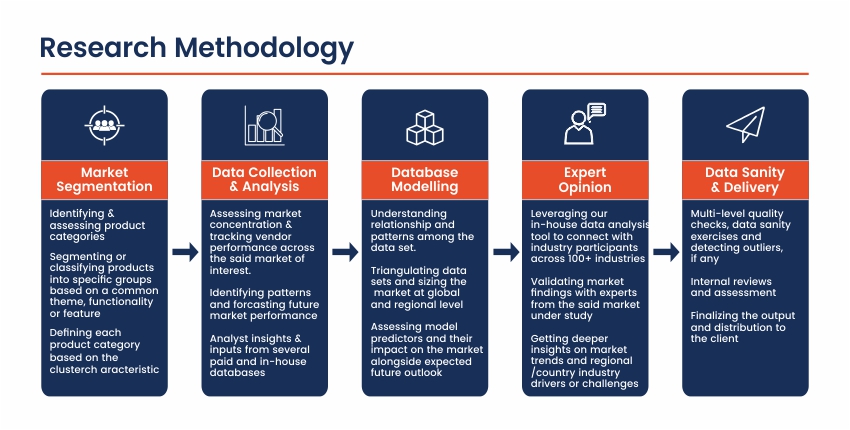
Table of Contents

Chapter 1. Research Methodology & Data Sources

1.1. Data Analysis Models
1.2. Research Scope & Assumptions
1.3. List of Primary & Secondary Data Sources 

Chapter 2. Executive Summary

2.1. Market Overview
2.2. Segment Overview
2.3. Market Size and Estimates, 2021 to 2033
2.4. Market Size and Estimates, By Segments, 2021 to 2033

Chapter 3. Industry Analysis

3.1. Market Segmentation
3.2. Market Definitions and Assumptions
3.3. Supply chain analysis
3.4. Porter’s five forces analysis
3.5. PEST analysis
3.6. Market Dynamics
3.6.1. Market Driver Analysis
3.6.2. Market Restraint analysis
3.6.3. Market Opportunity Analysis
3.7. Competitive Positioning Analysis, 2023
3.8. Key Player Ranking, 2023

Chapter 4. Market Segment Analysis- Segment 1

4.1.1. Historic Market Data & Future Forecasts, 2024-2033
4.1.2. Historic Market Data & Future Forecasts by Region, 2024-2033

Chapter 5. Market Segment Analysis- Segment 2

5.1.1. Historic Market Data & Future Forecasts, 2024-2033
5.1.2. Historic Market Data & Future Forecasts by Region, 2024-2033

Chapter 6. Regional or Country Market Insights

** Reports focusing on a particular region or country will contain data unique to that region or country **

6.1. Global Market Data & Future Forecasts, By Region 2024-2033

6.2. North America
6.2.1. Historic Market Data & Future Forecasts, 2024-2033
6.2.2. Historic Market Data & Future Forecasts, By Segment 1, 2024-2033
6.2.3. Historic Market Data & Future Forecasts, By Segment 2, 2024-2033

6.2.4. U.S.
6.2.4.1. Historic Market Data & Future Forecasts, 2024-2033
6.2.4.2. Historic Market Data & Future Forecasts, By Segment 1, 2024-2033
6.2.4.3. Historic Market Data & Future Forecasts, By Segment 2, 2024-2033

6.2.5. Canada
6.2.5.1. Historic Market Data & Future Forecasts, 2024-2033
6.2.5.2. Historic Market Data & Future Forecasts, By Segment 1, 2024-2033
6.2.5.3. Historic Market Data & Future Forecasts, By Segment 2, 2024-2033

6.3. Europe
6.3.1. Historic Market Data & Future Forecasts, 2024-2033
6.3.2. Historic Market Data & Future Forecasts, By Segment 1, 2024-2033
6.3.3. Historic Market Data & Future Forecasts, By Segment 2, 2024-2033

6.3.4. UK
6.3.4.1. Historic Market Data & Future Forecasts, 2024-2033
6.3.4.2. Historic Market Data & Future Forecasts, By Segment 1, 2024-2033
6.3.4.3. Historic Market Data & Future Forecasts, By Segment 2, 2024-2033

6.3.5. Germany
6.3.5.1. Historic Market Data & Future Forecasts, 2024-2033
6.3.5.2. Historic Market Data & Future Forecasts, By Segment 1, 2024-2033
6.3.5.3. Historic Market Data & Future Forecasts, By Segment 2, 2024-2033

6.3.6. France
6.3.6.1. Historic Market Data & Future Forecasts, 2024-2033
6.3.6.2. Historic Market Data & Future Forecasts, By Segment 1, 2024-2033
6.3.6.3. Historic Market Data & Future Forecasts, By Segment 2, 2024-2033

6.4. Asia Pacific
6.4.1. Historic Market Data & Future Forecasts, 2024-2033
6.4.2. Historic Market Data & Future Forecasts, By Segment 1, 2024-2033
6.4.3. Historic Market Data & Future Forecasts, By Segment 2, 2024-2033

6.4.4. China
6.4.4.1. Historic Market Data & Future Forecasts, 2024-2033
6.4.4.2. Historic Market Data & Future Forecasts, By Segment 1, 2024-2033
6.4.4.3. Historic Market Data & Future Forecasts, By Segment 2, 2024-2033

6.4.5. India
6.4.5.1. Historic Market Data & Future Forecasts, 2024-2033
6.4.5.2. Historic Market Data & Future Forecasts, By Segment 1, 2024-2033
6.4.5.3. Historic Market Data & Future Forecasts, By Segment 2, 2024-2033

6.4.6. Japan
6.4.6.1. Historic Market Data & Future Forecasts, 2024-2033
6.4.6.2. Historic Market Data & Future Forecasts, By Segment 1, 2024-2033
6.4.6.3. Historic Market Data & Future Forecasts, By Segment 2, 2024-2033

6.4.7. South Korea
6.4.7.1. Historic Market Data & Future Forecasts, 2024-2033
6.4.7.2. Historic Market Data & Future Forecasts, By Segment 1, 2024-2033
6.4.7.3. Historic Market Data & Future Forecasts, By Segment 2, 2024-2033

6.5. Latin America
6.5.1. Historic Market Data & Future Forecasts, 2024-2033
6.5.2. Historic Market Data & Future Forecasts, By Segment 1, 2024-2033
6.5.3. Historic Market Data & Future Forecasts, By Segment 2, 2024-2033

6.5.4. Brazil
6.5.4.1. Historic Market Data & Future Forecasts, 2024-2033
6.5.4.2. Historic Market Data & Future Forecasts, By Segment 1, 2024-2033
6.5.4.3. Historic Market Data & Future Forecasts, By Segment 2, 2024-2033

6.5.5. Mexico
6.5.5.1. Historic Market Data & Future Forecasts, 2024-2033
6.5.5.2. Historic Market Data & Future Forecasts, By Segment 1, 2024-2033
6.5.5.3. Historic Market Data & Future Forecasts, By Segment 2, 2024-2033

6.6. Middle East & Africa
6.6.1. Historic Market Data & Future Forecasts, 2024-2033
6.6.2. Historic Market Data & Future Forecasts, By Segment 1, 2024-2033
6.6.3. Historic Market Data & Future Forecasts, By Segment 2, 2024-2033

6.6.4. UAE
6.6.4.1. Historic Market Data & Future Forecasts, 2024-2033
6.6.4.2. Historic Market Data & Future Forecasts, By Segment 1, 2024-2033
6.6.4.3. Historic Market Data & Future Forecasts, By Segment 2, 2024-2033

6.6.5. Saudi Arabia
6.6.5.1. Historic Market Data & Future Forecasts, 2024-2033
6.6.5.2. Historic Market Data & Future Forecasts, By Segment 1, 2024-2033
6.6.5.3. Historic Market Data & Future Forecasts, By Segment 2, 2024-2033

6.6.6. South Africa
6.6.6.1. Historic Market Data & Future Forecasts, 2024-2033
6.6.6.2. Historic Market Data & Future Forecasts, By Segment 1, 2024-2033
6.6.6.3. Historic Market Data & Future Forecasts, By Segment 2, 2024-2033

Chapter 7. Competitive Landscape

7.1. Competitive Heatmap Analysis, 2023
7.2. Competitive Product Analysis

7.3. Company 1
7.3.1. Company Description
7.3.2. Financial Highlights
7.3.3. Product Portfolio
7.3.4. Strategic Initiatives

7.4. Company 2
7.4.1. Company Description
7.4.2. Financial Highlights
7.4.3. Product Portfolio
7.4.4. Strategic Initiatives

7.5. Company 3
7.5.1. Company Description
7.5.2. Financial Highlights
7.5.3. Product Portfolio
7.5.4. Strategic Initiatives

7.6. Company 4
7.6.1. Company Description
7.6.2. Financial Highlights
7.6.3. Product Portfolio
7.6.4. Strategic Initiatives

7.7. Company 5
7.7.1. Company Description
7.7.2. Financial Highlights
7.7.3. Product Portfolio
7.7.4. Strategic Initiatives

7.8. Company 6
7.8.1. Company Description
7.8.2. Financial Highlights
7.8.3. Product Portfolio
7.8.4. Strategic Initiatives

7.9. Company 7
7.9.1. Company Description
7.9.2. Financial Highlights
7.9.3. Product Portfolio
7.9.4. Strategic Initiatives

7.10. Company 8
7.10.1. Company Description
7.10.2. Financial Highlights
7.10.3. Product Portfolio
7.10.4. Strategic Initiatives

7.11. Company 9
7.11.1. Company Description
7.11.2. Financial Highlights
7.11.3. Product Portfolio
7.11.4. Strategic Initiatives

7.12. Company 10
7.12.1. Company Description
7.12.2. Financial Highlights
7.12.3. Product Portfolio
7.12.4. Strategic Initiatives

Research Methodology

Market Overview

The US oil and gas infrastructure market is a critical component of the nation’s energy sector, encompassing a vast network of pipelines, storage facilities, processing plants, and distribution systems. This infrastructure forms the backbone of America’s energy supply chain, facilitating the extraction, transportation, and delivery of oil and natural gas resources across the country. The market has undergone significant transformations in recent years, driven by technological advancements, changing energy policies, and fluctuating global demand.

The United States has emerged as a global leader in oil and gas production, largely due to the shale revolution and advancements in hydraulic fracturing and horizontal drilling technologies. This surge in domestic production has necessitated substantial investments in infrastructure to support the increased output and changing distribution patterns. The market has seen a shift from import-oriented infrastructure to export-focused facilities, particularly in the liquefied natural gas (LNG) sector.

As the energy landscape evolves, the oil and gas infrastructure market is facing both opportunities and challenges. On one hand, the continued reliance on fossil fuels in many sectors of the economy ensures ongoing demand for traditional infrastructure. On the other hand, the push for decarbonization and the growth of renewable energy sources are prompting companies to rethink their long-term infrastructure strategies. This has led to increased interest in developing infrastructure that can support both conventional and alternative energy sources, such as hydrogen-ready pipelines or facilities that can handle biofuels.

Key Takeaways of the market

  • The US oil and gas infrastructure market is undergoing significant transformation due to the shale revolution and changing global energy dynamics.
  • Investments in export-oriented infrastructure, particularly LNG facilities, have increased to capitalize on the US’s position as a major energy exporter.
  • Midstream infrastructure remains critical for connecting production sites with end-users and maintaining market efficiency.
  • Environmental concerns and regulatory pressures are driving investments in cleaner technologies and infrastructure upgrades.
  • Digital transformation and automation are becoming increasingly important for improving operational efficiency and safety.
  • Geopolitical factors are influencing infrastructure development and investment decisions.
  • The integration of renewable energy sources with existing oil and gas infrastructure is becoming more prevalent.
  • There is a growing trend towards repurposing existing infrastructure for new uses in the evolving energy landscape.

Market Driver

The US oil and gas infrastructure market is propelled by several key drivers that continue to shape its growth and evolution. One of the primary drivers is the sustained increase in domestic oil and gas production, particularly from shale formations. The shale revolution has transformed the United States into a net energy exporter, necessitating significant investments in infrastructure to support the transportation, processing, and export of these resources. This shift has led to a boom in pipeline construction, expansion of storage facilities, and development of export terminals, especially for liquefied natural gas (LNG).

Another crucial driver is the ongoing need for infrastructure modernization and replacement. Much of the existing oil and gas infrastructure in the United States is aging, with some pipelines and facilities dating back several decades. This aging infrastructure presents safety and efficiency concerns, driving investments in maintenance, upgrades, and replacements. The push for modernization is further fueled by the adoption of advanced technologies, such as smart sensors, artificial intelligence, and predictive maintenance systems, which promise to enhance operational efficiency, reduce downtime, and improve safety standards across the industry.

Lastly, the digitalization of the energy sector is driving investments in smart infrastructure and data management systems. Companies are increasingly recognizing the value of real-time data and analytics in optimizing operations, improving maintenance schedules, and enhancing overall asset performance. This is leading to investments in advanced sensors, Internet of Things (IoT) devices, and sophisticated control systems across the oil and gas infrastructure landscape.

Market Restraint

Despite the numerous drivers propelling the US oil and gas infrastructure market, several significant restraints pose challenges to its growth and development. One of the most prominent restraints is the increasing environmental scrutiny and opposition to fossil fuel infrastructure projects. Public concern over climate change and environmental impacts has led to growing resistance against new pipeline projects, LNG terminals, and other oil and gas facilities. This opposition often results in lengthy legal battles, project delays, and in some cases, cancellations, significantly impacting the pace of infrastructure development and increasing project costs.

Lastly, the physical impacts of climate change pose a growing restraint on infrastructure development and operation. Increased frequency and severity of extreme weather events, rising sea levels, and changing temperature patterns can affect the reliability and safety of oil and gas infrastructure, necessitating additional investments in resilience measures and potentially limiting the viable locations for new infrastructure projects.

Market Opportunity

The US oil and gas infrastructure market, despite facing various challenges, presents significant opportunities for growth and innovation. One of the most promising opportunities lies in the development of infrastructure to support the growing liquefied natural gas (LNG) export market. As global demand for cleaner energy sources increases, particularly in Asia and Europe, the United States is well-positioned to become a major LNG exporter. This trend is driving investments in LNG liquefaction plants, export terminals, and associated pipeline infrastructure, creating substantial opportunities for companies across the value chain.

Another key opportunity is the integration of digital technologies and automation into existing and new infrastructure. The concept of “smart infrastructure” is gaining traction, with the potential to revolutionize how oil and gas assets are operated and maintained. Advanced sensors, Internet of Things (IoT) devices, artificial intelligence, and machine learning algorithms can enhance operational efficiency, reduce downtime, and improve safety. Companies that can effectively implement these technologies stand to gain a significant competitive advantage in the market.

Lastly, the growing interconnectedness of global energy markets is creating opportunities for companies to expand their international presence. US firms with expertise in developing and operating advanced oil and gas infrastructure can leverage their knowledge and experience to pursue projects in emerging markets, particularly in regions looking to develop their own energy resources or transition to cleaner fuels.

Market Segment Analysis

Pipeline Infrastructure Segment: The pipeline infrastructure segment is a critical component of the US oil and gas market, serving as the primary means of transporting crude oil, natural gas, and refined products across the country. This segment has seen significant growth and transformation in recent years, driven by the shale boom and changing energy flow patterns. The US boasts an extensive network of pipelines, including gathering lines, transmission pipelines, and distribution systems, spanning hundreds of thousands of miles.

One of the key trends in this segment is the ongoing expansion and reconfiguration of pipeline networks to accommodate new production areas and market demands. For instance, there has been substantial investment in pipeline infrastructure connecting the Permian Basin to Gulf Coast export facilities, reflecting the shift from import-dependent to export-oriented energy flows. The segment has also witnessed innovations in pipeline materials and construction techniques, aimed at improving safety, reducing environmental impact, and enhancing operational efficiency.

Moreover, the pipeline segment is at the forefront of efforts to reduce methane emissions from the oil and gas sector. Companies are investing in advanced leak detection and repair technologies, as well as implementing more rigorous monitoring and maintenance programs. This focus on emissions reduction not only addresses environmental concerns but also improves operational efficiency by minimizing product loss.

The integration of digital technologies is transforming pipeline operations and maintenance. Smart pigging devices, equipped with sensors and data collection capabilities, are being used to assess pipeline integrity and identify potential issues before they escalate. Real-time monitoring systems and predictive analytics are enhancing pipeline operators’ ability to optimize flow rates, detect anomalies, and respond quickly to potential threats.

Storage Infrastructure Segment: The storage infrastructure segment plays a vital role in balancing supply and demand fluctuations in the oil and gas market. This segment encompasses various types of storage facilities, including underground natural gas storage, aboveground oil tanks, and strategic petroleum reserves. The importance of storage infrastructure has been underscored by recent market volatility, including the negative oil price event in 2020, which highlighted the critical role of storage in managing oversupply situations.

The storage segment has seen growing interest in expanding capacity, particularly for natural gas storage to support the increasing role of gas in power generation and exports. There is also a trend towards developing more flexible and responsive storage solutions that can quickly adapt to market changes. Advanced monitoring and control systems are being implemented to improve inventory management and operational efficiency.

The strategic petroleum reserve (SPR) infrastructure is also undergoing modernization efforts to enhance its flexibility and responsiveness to market disruptions. This includes investments in improved drawdown capabilities and potential expansion of storage capacity in strategic locations.

The storage segment is also seeing increased integration with digital technologies. Advanced sensors, data analytics, and artificial intelligence are being employed to optimize storage operations, improve inventory management, and enhance safety measures. These technologies enable real-time monitoring of storage conditions, predictive maintenance, and more efficient utilization of storage capacity.

Regional Analysis

The US oil and gas infrastructure market exhibits significant regional variations, reflecting the diverse geological, economic, and regulatory landscapes across the country. The Gulf Coast region, encompassing states like Texas and Louisiana, remains the heart of the US oil and gas infrastructure, boasting a dense network of pipelines, refineries, and export terminals. This region has seen substantial investments in recent years, particularly in LNG export facilities and petrochemical plants, capitalizing on abundant shale gas resources and strategic coastal locations.

The Permian Basin, spanning parts of Texas and New Mexico, has emerged as a critical focus area for infrastructure development. The region’s booming oil and gas production has driven significant investments in gathering systems, processing plants, and long-haul pipelines to transport resources to Gulf Coast markets and export facilities. However, the rapid pace of production growth has at times outpaced infrastructure development, leading to bottlenecks and driving demand for additional midstream capacity.

Each region faces unique challenges and opportunities in infrastructure development, influenced by factors such as resource availability, environmental regulations, public sentiment, and market dynamics. The interplay between these regional differences and national energy policies continues to shape the evolution of the US oil and gas infrastructure landscape.

Competitive Analysis

The US oil and gas infrastructure market is characterized by a diverse landscape of players, ranging from large integrated energy companies to specialized infrastructure operators and service providers. The competitive dynamics of the market are shaped by factors such as geographical presence, technological capabilities, financial strength, and regulatory compliance.

Major midstream companies, such as Kinder Morgan, Enterprise Products Partners, and Energy Transfer, dominate large segments of the pipeline and storage infrastructure market. These companies leverage their extensive network of assets, operational expertise, and economies of scale to maintain competitive advantages. They continue to expand their footprint through both organic growth projects and strategic acquisitions, often focusing on key production basins and export corridors.

In the LNG infrastructure segment, companies like Cheniere Energy have established themselves as leaders, capitalizing on first-mover advantages in developing export capacity. However, this segment is becoming increasingly competitive as more players enter the market, driven by growing global demand for LNG.

As the market evolves, companies are increasingly focusing on developing integrated solutions that span multiple segments of the value chain. This trend is driving consolidation and strategic partnerships as companies seek to enhance their competitive position and offer more comprehensive services to customers.

Key Industry Developments

  • Rapid expansion of LNG export capacity along the Gulf Coast, with multiple new terminals coming online and existing facilities expanding.
  • Increased focus on carbon capture and storage (CCS) infrastructure, with several major projects announced to decarbonize oil and gas operations.
  • Growing investments in hydrogen infrastructure, including pilot projects to blend hydrogen into existing natural gas pipeline networks.
  • Adoption of advanced leak detection and repair technologies to address methane emissions from oil and gas infrastructure.
  • Development of new pipeline projects to alleviate bottlenecks in key production areas, particularly in the Permian Basin.
  • Increased scrutiny and cancellation of several high-profile pipeline projects due to environmental concerns and legal challenges.
  • Implementation of cybersecurity measures and regulations to protect critical energy infrastructure from evolving threats.
  • Expansion of natural gas storage capacity to support growing LNG exports and power generation demand.
  • Implementation of advanced materials and coatings to enhance the durability and performance of infrastructure assets.

Future Outlook

The future outlook for the US oil and gas infrastructure market is characterized by both challenges and opportunities, shaped by the ongoing energy transition, technological advancements, and evolving market dynamics. While the short to medium-term outlook remains generally positive, with continued demand for oil and gas infrastructure, the long-term perspective is more complex and uncertain.

In the coming years, the market is likely to see continued investment in infrastructure to support LNG exports, as the United States solidifies its position as a major global supplier. This will drive development of not only export terminals but also associated pipelines and processing facilities. The focus on natural gas infrastructure is expected to remain strong, given its role as a transition fuel and its importance in backing up intermittent renewable energy sources.

However, the infrastructure market will need to adapt to the changing energy landscape. There will likely be increasing emphasis on developing flexible, multi-use infrastructure that can support both traditional hydrocarbons and emerging clean energy carriers like hydrogen. The repurposing of existing assets for new uses, such as converting natural gas pipelines for hydrogen transport or adapting offshore oil platforms for wind energy support, may become more prevalent.

Lastly, the role of hydrogen in the future energy mix presents both opportunities and challenges for the oil and gas infrastructure market. As hydrogen gains traction as a clean energy carrier, there will be growing need for infrastructure to produce, transport, and store hydrogen. This could create new avenues for growth and diversification for companies in the oil and gas infrastructure sector.

Market Segmentation

  • By Infrastructure Type:
    • Pipeline Infrastructure
    • Storage Infrastructure
    • Processing Infrastructure
    • LNG Infrastructure
    • Export Terminals
    • Distribution Networks
  • By Ownership:
    • Public Infrastructure
    • Private Infrastructure
    • Public-Private Partnerships
  • By Geography:
    • Gulf Coast Region
    • Northeast Region
    • Midwest Region
    • Rocky Mountain Region
    • West Coast Region
    • Alaska and Offshore
  • By Technology Integration:
    • Conventional Infrastructure
    • Smart/Digital Infrastructure
    • Hybrid Infrastructure
  • By Regulatory Framework:
    • Federally Regulated Infrastructure
    • State-Regulated Infrastructure
    • Municipally Regulated Infrastructure

Table of Contents

Chapter 1. Research Methodology & Data Sources

1.1. Data Analysis Models
1.2. Research Scope & Assumptions
1.3. List of Primary & Secondary Data Sources 

Chapter 2. Executive Summary

2.1. Market Overview
2.2. Segment Overview
2.3. Market Size and Estimates, 2021 to 2033
2.4. Market Size and Estimates, By Segments, 2021 to 2033

Chapter 3. Industry Analysis

3.1. Market Segmentation
3.2. Market Definitions and Assumptions
3.3. Supply chain analysis
3.4. Porter’s five forces analysis
3.5. PEST analysis
3.6. Market Dynamics
3.6.1. Market Driver Analysis
3.6.2. Market Restraint analysis
3.6.3. Market Opportunity Analysis
3.7. Competitive Positioning Analysis, 2023
3.8. Key Player Ranking, 2023

Chapter 4. Market Segment Analysis- Segment 1

4.1.1. Historic Market Data & Future Forecasts, 2024-2033
4.1.2. Historic Market Data & Future Forecasts by Region, 2024-2033

Chapter 5. Market Segment Analysis- Segment 2

5.1.1. Historic Market Data & Future Forecasts, 2024-2033
5.1.2. Historic Market Data & Future Forecasts by Region, 2024-2033

Chapter 6. Regional or Country Market Insights

** Reports focusing on a particular region or country will contain data unique to that region or country **

6.1. Global Market Data & Future Forecasts, By Region 2024-2033

6.2. North America
6.2.1. Historic Market Data & Future Forecasts, 2024-2033
6.2.2. Historic Market Data & Future Forecasts, By Segment 1, 2024-2033
6.2.3. Historic Market Data & Future Forecasts, By Segment 2, 2024-2033

6.2.4. U.S.
6.2.4.1. Historic Market Data & Future Forecasts, 2024-2033
6.2.4.2. Historic Market Data & Future Forecasts, By Segment 1, 2024-2033
6.2.4.3. Historic Market Data & Future Forecasts, By Segment 2, 2024-2033

6.2.5. Canada
6.2.5.1. Historic Market Data & Future Forecasts, 2024-2033
6.2.5.2. Historic Market Data & Future Forecasts, By Segment 1, 2024-2033
6.2.5.3. Historic Market Data & Future Forecasts, By Segment 2, 2024-2033

6.3. Europe
6.3.1. Historic Market Data & Future Forecasts, 2024-2033
6.3.2. Historic Market Data & Future Forecasts, By Segment 1, 2024-2033
6.3.3. Historic Market Data & Future Forecasts, By Segment 2, 2024-2033

6.3.4. UK
6.3.4.1. Historic Market Data & Future Forecasts, 2024-2033
6.3.4.2. Historic Market Data & Future Forecasts, By Segment 1, 2024-2033
6.3.4.3. Historic Market Data & Future Forecasts, By Segment 2, 2024-2033

6.3.5. Germany
6.3.5.1. Historic Market Data & Future Forecasts, 2024-2033
6.3.5.2. Historic Market Data & Future Forecasts, By Segment 1, 2024-2033
6.3.5.3. Historic Market Data & Future Forecasts, By Segment 2, 2024-2033

6.3.6. France
6.3.6.1. Historic Market Data & Future Forecasts, 2024-2033
6.3.6.2. Historic Market Data & Future Forecasts, By Segment 1, 2024-2033
6.3.6.3. Historic Market Data & Future Forecasts, By Segment 2, 2024-2033

6.4. Asia Pacific
6.4.1. Historic Market Data & Future Forecasts, 2024-2033
6.4.2. Historic Market Data & Future Forecasts, By Segment 1, 2024-2033
6.4.3. Historic Market Data & Future Forecasts, By Segment 2, 2024-2033

6.4.4. China
6.4.4.1. Historic Market Data & Future Forecasts, 2024-2033
6.4.4.2. Historic Market Data & Future Forecasts, By Segment 1, 2024-2033
6.4.4.3. Historic Market Data & Future Forecasts, By Segment 2, 2024-2033

6.4.5. India
6.4.5.1. Historic Market Data & Future Forecasts, 2024-2033
6.4.5.2. Historic Market Data & Future Forecasts, By Segment 1, 2024-2033
6.4.5.3. Historic Market Data & Future Forecasts, By Segment 2, 2024-2033

6.4.6. Japan
6.4.6.1. Historic Market Data & Future Forecasts, 2024-2033
6.4.6.2. Historic Market Data & Future Forecasts, By Segment 1, 2024-2033
6.4.6.3. Historic Market Data & Future Forecasts, By Segment 2, 2024-2033

6.4.7. South Korea
6.4.7.1. Historic Market Data & Future Forecasts, 2024-2033
6.4.7.2. Historic Market Data & Future Forecasts, By Segment 1, 2024-2033
6.4.7.3. Historic Market Data & Future Forecasts, By Segment 2, 2024-2033

6.5. Latin America
6.5.1. Historic Market Data & Future Forecasts, 2024-2033
6.5.2. Historic Market Data & Future Forecasts, By Segment 1, 2024-2033
6.5.3. Historic Market Data & Future Forecasts, By Segment 2, 2024-2033

6.5.4. Brazil
6.5.4.1. Historic Market Data & Future Forecasts, 2024-2033
6.5.4.2. Historic Market Data & Future Forecasts, By Segment 1, 2024-2033
6.5.4.3. Historic Market Data & Future Forecasts, By Segment 2, 2024-2033

6.5.5. Mexico
6.5.5.1. Historic Market Data & Future Forecasts, 2024-2033
6.5.5.2. Historic Market Data & Future Forecasts, By Segment 1, 2024-2033
6.5.5.3. Historic Market Data & Future Forecasts, By Segment 2, 2024-2033

6.6. Middle East & Africa
6.6.1. Historic Market Data & Future Forecasts, 2024-2033
6.6.2. Historic Market Data & Future Forecasts, By Segment 1, 2024-2033
6.6.3. Historic Market Data & Future Forecasts, By Segment 2, 2024-2033

6.6.4. UAE
6.6.4.1. Historic Market Data & Future Forecasts, 2024-2033
6.6.4.2. Historic Market Data & Future Forecasts, By Segment 1, 2024-2033
6.6.4.3. Historic Market Data & Future Forecasts, By Segment 2, 2024-2033

6.6.5. Saudi Arabia
6.6.5.1. Historic Market Data & Future Forecasts, 2024-2033
6.6.5.2. Historic Market Data & Future Forecasts, By Segment 1, 2024-2033
6.6.5.3. Historic Market Data & Future Forecasts, By Segment 2, 2024-2033

6.6.6. South Africa
6.6.6.1. Historic Market Data & Future Forecasts, 2024-2033
6.6.6.2. Historic Market Data & Future Forecasts, By Segment 1, 2024-2033
6.6.6.3. Historic Market Data & Future Forecasts, By Segment 2, 2024-2033

Chapter 7. Competitive Landscape

7.1. Competitive Heatmap Analysis, 2023
7.2. Competitive Product Analysis

7.3. Company 1
7.3.1. Company Description
7.3.2. Financial Highlights
7.3.3. Product Portfolio
7.3.4. Strategic Initiatives

7.4. Company 2
7.4.1. Company Description
7.4.2. Financial Highlights
7.4.3. Product Portfolio
7.4.4. Strategic Initiatives

7.5. Company 3
7.5.1. Company Description
7.5.2. Financial Highlights
7.5.3. Product Portfolio
7.5.4. Strategic Initiatives

7.6. Company 4
7.6.1. Company Description
7.6.2. Financial Highlights
7.6.3. Product Portfolio
7.6.4. Strategic Initiatives

7.7. Company 5
7.7.1. Company Description
7.7.2. Financial Highlights
7.7.3. Product Portfolio
7.7.4. Strategic Initiatives

7.8. Company 6
7.8.1. Company Description
7.8.2. Financial Highlights
7.8.3. Product Portfolio
7.8.4. Strategic Initiatives

7.9. Company 7
7.9.1. Company Description
7.9.2. Financial Highlights
7.9.3. Product Portfolio
7.9.4. Strategic Initiatives

7.10. Company 8
7.10.1. Company Description
7.10.2. Financial Highlights
7.10.3. Product Portfolio
7.10.4. Strategic Initiatives

7.11. Company 9
7.11.1. Company Description
7.11.2. Financial Highlights
7.11.3. Product Portfolio
7.11.4. Strategic Initiatives

7.12. Company 10
7.12.1. Company Description
7.12.2. Financial Highlights
7.12.3. Product Portfolio
7.12.4. Strategic Initiatives

Research Methodology

Frequently Asked Questions About This Report

Choose License Type

$1,800
$2,340
$2,970

Our salient features

Best Solution

We will assist you in comprehending the value propositions of various reports across multiple domains and recommend the optimal solution to meet your research requirements.

Customized Research

Our team of analysts and consultants provide assistance for customized research requirements

Max ROI

Guaranteed maximum assistance to help you get your reports at the optimum prices, thereby ensuring maximum returns on investment.

24/7 Support

24X7 availability to help you through the buying process as well as answer any of your doubts.

Get a free sample report

This free sample study provides a comprehensive overview of the report, including an executive summary, market segments, complete analysis, country-level analysis, and more.

Our Clients

We've Received Your Request

We Thank You for filling out your requirements. Our sales team will get in touch with you shortly.