FRP Composite Rebar Market Size, Share, Growth, Trends, Statistics Analysis Report and By Segment Forecasts 2024 to 2033

Market Overview

The FRP (Fiber Reinforced Polymer) composite rebar market has been experiencing robust growth driven by its superior properties over traditional steel rebars. FRP rebars are made from fibers such as glass, carbon, or basalt embedded in a polymer matrix, offering advantages such as high strength-to-weight ratio, corrosion resistance, and electromagnetic neutrality. These properties make FRP rebars suitable for a wide range of applications in construction, infrastructure development, and rehabilitation projects worldwide. The market is characterized by technological advancements, increasing infrastructure investments, and growing awareness about sustainability in construction practices.
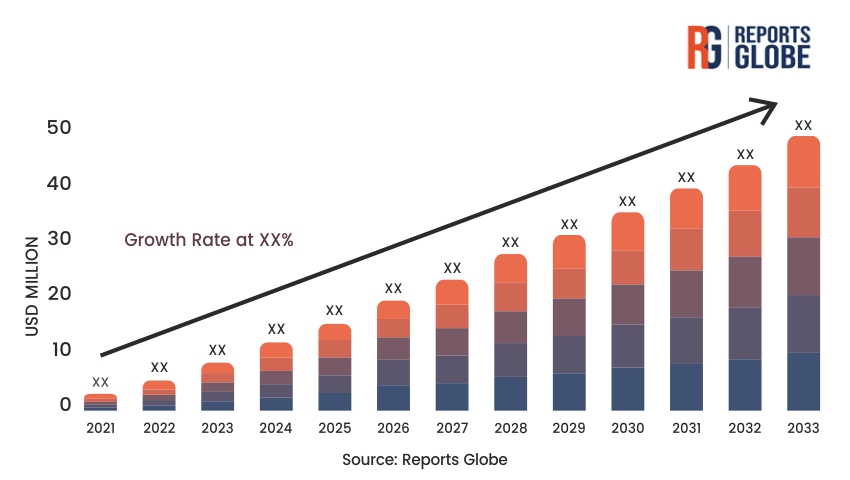
Key Takeaways of the Market

  • Rising demand for corrosion-resistant reinforcement solutions in harsh environments.
  • Advantages of FRP rebars in terms of durability, lightweight nature, and ease of installation.
  • Increasing adoption in sectors such as bridges, highways, marine structures, and buildings.
  • Challenges related to cost competitiveness compared to traditional steel rebars in some applications.
  • Opportunities in retrofitting and rehabilitation projects to enhance structural integrity and lifespan.

Market Driver

A significant driver for the FRP composite rebar market is its superior corrosion resistance compared to traditional steel rebars. Corrosion of steel rebars in concrete structures leads to structural deterioration, impacting safety and maintenance costs. FRP rebars, being non-metallic, do not corrode and offer extended service life in harsh environments, such as marine structures and chloride-rich environments. As infrastructure ages and maintenance costs rise, the demand for durable and corrosion-resistant reinforcement solutions continues to grow, propelling the adoption of FRP rebars globally.

Market Restraint

Despite their advantages, FRP composite rebars face challenges related to cost competitiveness. The initial cost of FRP rebars is higher than that of steel rebars, which can deter adoption in cost-sensitive construction projects. Moreover, the price volatility of raw materials used in FRP production, such as glass and carbon fibers, impacts overall product pricing. Overcoming these cost barriers through technological advancements, economies of scale, and regulatory incentives remains crucial for broader market penetration of FRP rebars, particularly in large-scale infrastructure projects.

Market Opportunity

An emerging opportunity lies in the retrofitting and rehabilitation of aging infrastructure with FRP composite rebars. Many countries are facing challenges related to deteriorating infrastructure, necessitating cost-effective solutions to extend the service life of existing structures. FRP rebars offer a viable alternative for strengthening and retrofitting bridges, buildings, and other critical infrastructure without the need for extensive demolition. As governments and private sectors prioritize infrastructure resilience and sustainability, the demand for FRP rebars in retrofit projects is expected to grow significantly.

Market Segment Analysis

  1. Construction Sector: The construction sector represents the largest segment for FRP composite rebars, driven by their increasing adoption in new builds and infrastructure projects. FRP rebars offer advantages such as lightweight, ease of handling, and resistance to corrosion, making them suitable for various concrete applications, including foundations, columns, and beams. Their use in high-rise buildings, bridges, tunnels, and industrial structures is expanding, supported by regulatory requirements for sustainable building materials and durability standards.
  2. Infrastructure Sector: Within the infrastructure segment, FRP rebars are extensively used in transportation infrastructure, including bridges, highways, and tunnels. These structures are exposed to harsh environmental conditions, such as saltwater, humidity, and chemical exposure, where traditional steel rebars are prone to corrosion. FRP rebars provide long-term durability, reducing maintenance costs and enhancing structural lifespan. As governments worldwide invest in infrastructure modernization and resilience, the demand for FRP rebars in infrastructure applications is set to increase.

Regional Analysis

The FRP composite rebar market exhibits regional variations influenced by infrastructure development, regulatory frameworks, and construction practices:

  • North America: Leading market due to stringent regulations promoting sustainable building practices and increasing investments in infrastructure rehabilitation.
  • Europe: Growing adoption driven by sustainability initiatives, urban redevelopment projects, and the need for corrosion-resistant reinforcement solutions.
  • Asia Pacific: Rapid urbanization, infrastructure expansion, and investments in transportation networks propel market growth, particularly in countries like China and India.
  • Middle East and Africa: Increasing construction activities and investments in oil and gas infrastructure drive demand for FRP rebars despite challenges related to market penetration and regulatory compliance.
  • Latin America: Emerging market with opportunities in infrastructure development and retrofitting projects, supported by government initiatives to improve structural resilience.

Competitive Analysis

The FRP composite rebar market is competitive with several key players focusing on product innovation, strategic partnerships, and geographical expansion:

  • Major Players: Companies such as Hughes Brothers, Schoeck International, Pultron Composites, and Sireg Geotech are prominent in the global market.
  • Strategic Initiatives: Emphasis on research and development to enhance product performance, certifications to meet regulatory standards, and collaborations with construction firms and government bodies.
  • Market Expansion: Geographical expansion into emerging economies, acquisitions to strengthen market presence, and investments in production capacities and distribution networks.

Key Industry Developments

  • Introduction of next-generation FRP composite rebars with enhanced mechanical properties.
  • Technological advancements in manufacturing processes to reduce production costs and improve product quality.
  • Standardization efforts and certifications to meet regulatory requirements and enhance market credibility.
  • Collaborative research projects between academia and industry to explore new applications and sustainable practices in FRP reinforcement technologies.
  • Adoption of digital tools and building information modeling (BIM) for designing and implementing FRP rebar solutions in construction projects.

Future Outlook

Looking ahead, the FRP composite rebar market is poised for significant growth driven by infrastructure development, sustainability trends, and advancements in construction technologies. The market’s expansion will be supported by increasing awareness about the benefits of FRP rebars, regulatory support for sustainable building materials, and innovations in composite materials. Continued investments in infrastructure modernization, urban redevelopment, and retrofitting projects present lucrative opportunities for market players to capitalize on the demand for durable and cost-effective reinforcement solutions.

Market Segmentation

  • Infrastructure
  • Construction
  • Others (marine structures, industrial applications)

Table of Contents

Chapter 1. Research Methodology & Data Sources

1.1. Data Analysis Models
1.2. Research Scope & Assumptions
1.3. List of Primary & Secondary Data Sources 

Chapter 2. Executive Summary

2.1. Market Overview
2.2. Segment Overview
2.3. Market Size and Estimates, 2021 to 2033
2.4. Market Size and Estimates, By Segments, 2021 to 2033

Chapter 3. Industry Analysis

3.1. Market Segmentation
3.2. Market Definitions and Assumptions
3.3. Supply chain analysis
3.4. Porter’s five forces analysis
3.5. PEST analysis
3.6. Market Dynamics
3.6.1. Market Driver Analysis
3.6.2. Market Restraint analysis
3.6.3. Market Opportunity Analysis
3.7. Competitive Positioning Analysis, 2023
3.8. Key Player Ranking, 2023

Chapter 4. Market Segment Analysis- Segment 1

4.1.1. Historic Market Data & Future Forecasts, 2024-2033
4.1.2. Historic Market Data & Future Forecasts by Region, 2024-2033

Chapter 5. Market Segment Analysis- Segment 2

5.1.1. Historic Market Data & Future Forecasts, 2024-2033
5.1.2. Historic Market Data & Future Forecasts by Region, 2024-2033

Chapter 6. Regional or Country Market Insights

** Reports focusing on a particular region or country will contain data unique to that region or country **

6.1. Global Market Data & Future Forecasts, By Region 2024-2033

6.2. North America
6.2.1. Historic Market Data & Future Forecasts, 2024-2033
6.2.2. Historic Market Data & Future Forecasts, By Segment 1, 2024-2033
6.2.3. Historic Market Data & Future Forecasts, By Segment 2, 2024-2033

6.2.4. U.S.
6.2.4.1. Historic Market Data & Future Forecasts, 2024-2033
6.2.4.2. Historic Market Data & Future Forecasts, By Segment 1, 2024-2033
6.2.4.3. Historic Market Data & Future Forecasts, By Segment 2, 2024-2033

6.2.5. Canada
6.2.5.1. Historic Market Data & Future Forecasts, 2024-2033
6.2.5.2. Historic Market Data & Future Forecasts, By Segment 1, 2024-2033
6.2.5.3. Historic Market Data & Future Forecasts, By Segment 2, 2024-2033

6.3. Europe
6.3.1. Historic Market Data & Future Forecasts, 2024-2033
6.3.2. Historic Market Data & Future Forecasts, By Segment 1, 2024-2033
6.3.3. Historic Market Data & Future Forecasts, By Segment 2, 2024-2033

6.3.4. UK
6.3.4.1. Historic Market Data & Future Forecasts, 2024-2033
6.3.4.2. Historic Market Data & Future Forecasts, By Segment 1, 2024-2033
6.3.4.3. Historic Market Data & Future Forecasts, By Segment 2, 2024-2033

6.3.5. Germany
6.3.5.1. Historic Market Data & Future Forecasts, 2024-2033
6.3.5.2. Historic Market Data & Future Forecasts, By Segment 1, 2024-2033
6.3.5.3. Historic Market Data & Future Forecasts, By Segment 2, 2024-2033

6.3.6. France
6.3.6.1. Historic Market Data & Future Forecasts, 2024-2033
6.3.6.2. Historic Market Data & Future Forecasts, By Segment 1, 2024-2033
6.3.6.3. Historic Market Data & Future Forecasts, By Segment 2, 2024-2033

6.4. Asia Pacific
6.4.1. Historic Market Data & Future Forecasts, 2024-2033
6.4.2. Historic Market Data & Future Forecasts, By Segment 1, 2024-2033
6.4.3. Historic Market Data & Future Forecasts, By Segment 2, 2024-2033

6.4.4. China
6.4.4.1. Historic Market Data & Future Forecasts, 2024-2033
6.4.4.2. Historic Market Data & Future Forecasts, By Segment 1, 2024-2033
6.4.4.3. Historic Market Data & Future Forecasts, By Segment 2, 2024-2033

6.4.5. India
6.4.5.1. Historic Market Data & Future Forecasts, 2024-2033
6.4.5.2. Historic Market Data & Future Forecasts, By Segment 1, 2024-2033
6.4.5.3. Historic Market Data & Future Forecasts, By Segment 2, 2024-2033

6.4.6. Japan
6.4.6.1. Historic Market Data & Future Forecasts, 2024-2033
6.4.6.2. Historic Market Data & Future Forecasts, By Segment 1, 2024-2033
6.4.6.3. Historic Market Data & Future Forecasts, By Segment 2, 2024-2033

6.4.7. South Korea
6.4.7.1. Historic Market Data & Future Forecasts, 2024-2033
6.4.7.2. Historic Market Data & Future Forecasts, By Segment 1, 2024-2033
6.4.7.3. Historic Market Data & Future Forecasts, By Segment 2, 2024-2033

6.5. Latin America
6.5.1. Historic Market Data & Future Forecasts, 2024-2033
6.5.2. Historic Market Data & Future Forecasts, By Segment 1, 2024-2033
6.5.3. Historic Market Data & Future Forecasts, By Segment 2, 2024-2033

6.5.4. Brazil
6.5.4.1. Historic Market Data & Future Forecasts, 2024-2033
6.5.4.2. Historic Market Data & Future Forecasts, By Segment 1, 2024-2033
6.5.4.3. Historic Market Data & Future Forecasts, By Segment 2, 2024-2033

6.5.5. Mexico
6.5.5.1. Historic Market Data & Future Forecasts, 2024-2033
6.5.5.2. Historic Market Data & Future Forecasts, By Segment 1, 2024-2033
6.5.5.3. Historic Market Data & Future Forecasts, By Segment 2, 2024-2033

6.6. Middle East & Africa
6.6.1. Historic Market Data & Future Forecasts, 2024-2033
6.6.2. Historic Market Data & Future Forecasts, By Segment 1, 2024-2033
6.6.3. Historic Market Data & Future Forecasts, By Segment 2, 2024-2033

6.6.4. UAE
6.6.4.1. Historic Market Data & Future Forecasts, 2024-2033
6.6.4.2. Historic Market Data & Future Forecasts, By Segment 1, 2024-2033
6.6.4.3. Historic Market Data & Future Forecasts, By Segment 2, 2024-2033

6.6.5. Saudi Arabia
6.6.5.1. Historic Market Data & Future Forecasts, 2024-2033
6.6.5.2. Historic Market Data & Future Forecasts, By Segment 1, 2024-2033
6.6.5.3. Historic Market Data & Future Forecasts, By Segment 2, 2024-2033

6.6.6. South Africa
6.6.6.1. Historic Market Data & Future Forecasts, 2024-2033
6.6.6.2. Historic Market Data & Future Forecasts, By Segment 1, 2024-2033
6.6.6.3. Historic Market Data & Future Forecasts, By Segment 2, 2024-2033

Chapter 7. Competitive Landscape

7.1. Competitive Heatmap Analysis, 2023
7.2. Competitive Product Analysis

7.3. Company 1
7.3.1. Company Description
7.3.2. Financial Highlights
7.3.3. Product Portfolio
7.3.4. Strategic Initiatives

7.4. Company 2
7.4.1. Company Description
7.4.2. Financial Highlights
7.4.3. Product Portfolio
7.4.4. Strategic Initiatives

7.5. Company 3
7.5.1. Company Description
7.5.2. Financial Highlights
7.5.3. Product Portfolio
7.5.4. Strategic Initiatives

7.6. Company 4
7.6.1. Company Description
7.6.2. Financial Highlights
7.6.3. Product Portfolio
7.6.4. Strategic Initiatives

7.7. Company 5
7.7.1. Company Description
7.7.2. Financial Highlights
7.7.3. Product Portfolio
7.7.4. Strategic Initiatives

7.8. Company 6
7.8.1. Company Description
7.8.2. Financial Highlights
7.8.3. Product Portfolio
7.8.4. Strategic Initiatives

7.9. Company 7
7.9.1. Company Description
7.9.2. Financial Highlights
7.9.3. Product Portfolio
7.9.4. Strategic Initiatives

7.10. Company 8
7.10.1. Company Description
7.10.2. Financial Highlights
7.10.3. Product Portfolio
7.10.4. Strategic Initiatives

7.11. Company 9
7.11.1. Company Description
7.11.2. Financial Highlights
7.11.3. Product Portfolio
7.11.4. Strategic Initiatives

7.12. Company 10
7.12.1. Company Description
7.12.2. Financial Highlights
7.12.3. Product Portfolio
7.12.4. Strategic Initiatives

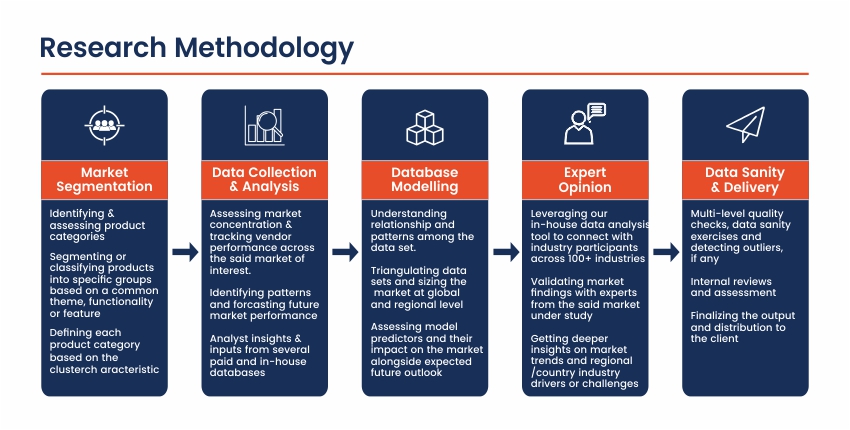
Research Methodology

Market Overview

The FRP (Fiber Reinforced Polymer) composite rebar market has been experiencing robust growth driven by its superior properties over traditional steel rebars. FRP rebars are made from fibers such as glass, carbon, or basalt embedded in a polymer matrix, offering advantages such as high strength-to-weight ratio, corrosion resistance, and electromagnetic neutrality. These properties make FRP rebars suitable for a wide range of applications in construction, infrastructure development, and rehabilitation projects worldwide. The market is characterized by technological advancements, increasing infrastructure investments, and growing awareness about sustainability in construction practices.

Key Takeaways of the Market

  • Rising demand for corrosion-resistant reinforcement solutions in harsh environments.
  • Advantages of FRP rebars in terms of durability, lightweight nature, and ease of installation.
  • Increasing adoption in sectors such as bridges, highways, marine structures, and buildings.
  • Challenges related to cost competitiveness compared to traditional steel rebars in some applications.
  • Opportunities in retrofitting and rehabilitation projects to enhance structural integrity and lifespan.

Market Driver

A significant driver for the FRP composite rebar market is its superior corrosion resistance compared to traditional steel rebars. Corrosion of steel rebars in concrete structures leads to structural deterioration, impacting safety and maintenance costs. FRP rebars, being non-metallic, do not corrode and offer extended service life in harsh environments, such as marine structures and chloride-rich environments. As infrastructure ages and maintenance costs rise, the demand for durable and corrosion-resistant reinforcement solutions continues to grow, propelling the adoption of FRP rebars globally.

Market Restraint

Despite their advantages, FRP composite rebars face challenges related to cost competitiveness. The initial cost of FRP rebars is higher than that of steel rebars, which can deter adoption in cost-sensitive construction projects. Moreover, the price volatility of raw materials used in FRP production, such as glass and carbon fibers, impacts overall product pricing. Overcoming these cost barriers through technological advancements, economies of scale, and regulatory incentives remains crucial for broader market penetration of FRP rebars, particularly in large-scale infrastructure projects.

Market Opportunity

An emerging opportunity lies in the retrofitting and rehabilitation of aging infrastructure with FRP composite rebars. Many countries are facing challenges related to deteriorating infrastructure, necessitating cost-effective solutions to extend the service life of existing structures. FRP rebars offer a viable alternative for strengthening and retrofitting bridges, buildings, and other critical infrastructure without the need for extensive demolition. As governments and private sectors prioritize infrastructure resilience and sustainability, the demand for FRP rebars in retrofit projects is expected to grow significantly.

Market Segment Analysis

  1. Construction Sector: The construction sector represents the largest segment for FRP composite rebars, driven by their increasing adoption in new builds and infrastructure projects. FRP rebars offer advantages such as lightweight, ease of handling, and resistance to corrosion, making them suitable for various concrete applications, including foundations, columns, and beams. Their use in high-rise buildings, bridges, tunnels, and industrial structures is expanding, supported by regulatory requirements for sustainable building materials and durability standards.
  2. Infrastructure Sector: Within the infrastructure segment, FRP rebars are extensively used in transportation infrastructure, including bridges, highways, and tunnels. These structures are exposed to harsh environmental conditions, such as saltwater, humidity, and chemical exposure, where traditional steel rebars are prone to corrosion. FRP rebars provide long-term durability, reducing maintenance costs and enhancing structural lifespan. As governments worldwide invest in infrastructure modernization and resilience, the demand for FRP rebars in infrastructure applications is set to increase.

Regional Analysis

The FRP composite rebar market exhibits regional variations influenced by infrastructure development, regulatory frameworks, and construction practices:

  • North America: Leading market due to stringent regulations promoting sustainable building practices and increasing investments in infrastructure rehabilitation.
  • Europe: Growing adoption driven by sustainability initiatives, urban redevelopment projects, and the need for corrosion-resistant reinforcement solutions.
  • Asia Pacific: Rapid urbanization, infrastructure expansion, and investments in transportation networks propel market growth, particularly in countries like China and India.
  • Middle East and Africa: Increasing construction activities and investments in oil and gas infrastructure drive demand for FRP rebars despite challenges related to market penetration and regulatory compliance.
  • Latin America: Emerging market with opportunities in infrastructure development and retrofitting projects, supported by government initiatives to improve structural resilience.

Competitive Analysis

The FRP composite rebar market is competitive with several key players focusing on product innovation, strategic partnerships, and geographical expansion:

  • Major Players: Companies such as Hughes Brothers, Schoeck International, Pultron Composites, and Sireg Geotech are prominent in the global market.
  • Strategic Initiatives: Emphasis on research and development to enhance product performance, certifications to meet regulatory standards, and collaborations with construction firms and government bodies.
  • Market Expansion: Geographical expansion into emerging economies, acquisitions to strengthen market presence, and investments in production capacities and distribution networks.

Key Industry Developments

  • Introduction of next-generation FRP composite rebars with enhanced mechanical properties.
  • Technological advancements in manufacturing processes to reduce production costs and improve product quality.
  • Standardization efforts and certifications to meet regulatory requirements and enhance market credibility.
  • Collaborative research projects between academia and industry to explore new applications and sustainable practices in FRP reinforcement technologies.
  • Adoption of digital tools and building information modeling (BIM) for designing and implementing FRP rebar solutions in construction projects.

Future Outlook

Looking ahead, the FRP composite rebar market is poised for significant growth driven by infrastructure development, sustainability trends, and advancements in construction technologies. The market’s expansion will be supported by increasing awareness about the benefits of FRP rebars, regulatory support for sustainable building materials, and innovations in composite materials. Continued investments in infrastructure modernization, urban redevelopment, and retrofitting projects present lucrative opportunities for market players to capitalize on the demand for durable and cost-effective reinforcement solutions.

Market Segmentation

  • Infrastructure
  • Construction
  • Others (marine structures, industrial applications)

Table of Contents

Chapter 1. Research Methodology & Data Sources

1.1. Data Analysis Models
1.2. Research Scope & Assumptions
1.3. List of Primary & Secondary Data Sources 

Chapter 2. Executive Summary

2.1. Market Overview
2.2. Segment Overview
2.3. Market Size and Estimates, 2021 to 2033
2.4. Market Size and Estimates, By Segments, 2021 to 2033

Chapter 3. Industry Analysis

3.1. Market Segmentation
3.2. Market Definitions and Assumptions
3.3. Supply chain analysis
3.4. Porter’s five forces analysis
3.5. PEST analysis
3.6. Market Dynamics
3.6.1. Market Driver Analysis
3.6.2. Market Restraint analysis
3.6.3. Market Opportunity Analysis
3.7. Competitive Positioning Analysis, 2023
3.8. Key Player Ranking, 2023

Chapter 4. Market Segment Analysis- Segment 1

4.1.1. Historic Market Data & Future Forecasts, 2024-2033
4.1.2. Historic Market Data & Future Forecasts by Region, 2024-2033

Chapter 5. Market Segment Analysis- Segment 2

5.1.1. Historic Market Data & Future Forecasts, 2024-2033
5.1.2. Historic Market Data & Future Forecasts by Region, 2024-2033

Chapter 6. Regional or Country Market Insights

** Reports focusing on a particular region or country will contain data unique to that region or country **

6.1. Global Market Data & Future Forecasts, By Region 2024-2033

6.2. North America
6.2.1. Historic Market Data & Future Forecasts, 2024-2033
6.2.2. Historic Market Data & Future Forecasts, By Segment 1, 2024-2033
6.2.3. Historic Market Data & Future Forecasts, By Segment 2, 2024-2033

6.2.4. U.S.
6.2.4.1. Historic Market Data & Future Forecasts, 2024-2033
6.2.4.2. Historic Market Data & Future Forecasts, By Segment 1, 2024-2033
6.2.4.3. Historic Market Data & Future Forecasts, By Segment 2, 2024-2033

6.2.5. Canada
6.2.5.1. Historic Market Data & Future Forecasts, 2024-2033
6.2.5.2. Historic Market Data & Future Forecasts, By Segment 1, 2024-2033
6.2.5.3. Historic Market Data & Future Forecasts, By Segment 2, 2024-2033

6.3. Europe
6.3.1. Historic Market Data & Future Forecasts, 2024-2033
6.3.2. Historic Market Data & Future Forecasts, By Segment 1, 2024-2033
6.3.3. Historic Market Data & Future Forecasts, By Segment 2, 2024-2033

6.3.4. UK
6.3.4.1. Historic Market Data & Future Forecasts, 2024-2033
6.3.4.2. Historic Market Data & Future Forecasts, By Segment 1, 2024-2033
6.3.4.3. Historic Market Data & Future Forecasts, By Segment 2, 2024-2033

6.3.5. Germany
6.3.5.1. Historic Market Data & Future Forecasts, 2024-2033
6.3.5.2. Historic Market Data & Future Forecasts, By Segment 1, 2024-2033
6.3.5.3. Historic Market Data & Future Forecasts, By Segment 2, 2024-2033

6.3.6. France
6.3.6.1. Historic Market Data & Future Forecasts, 2024-2033
6.3.6.2. Historic Market Data & Future Forecasts, By Segment 1, 2024-2033
6.3.6.3. Historic Market Data & Future Forecasts, By Segment 2, 2024-2033

6.4. Asia Pacific
6.4.1. Historic Market Data & Future Forecasts, 2024-2033
6.4.2. Historic Market Data & Future Forecasts, By Segment 1, 2024-2033
6.4.3. Historic Market Data & Future Forecasts, By Segment 2, 2024-2033

6.4.4. China
6.4.4.1. Historic Market Data & Future Forecasts, 2024-2033
6.4.4.2. Historic Market Data & Future Forecasts, By Segment 1, 2024-2033
6.4.4.3. Historic Market Data & Future Forecasts, By Segment 2, 2024-2033

6.4.5. India
6.4.5.1. Historic Market Data & Future Forecasts, 2024-2033
6.4.5.2. Historic Market Data & Future Forecasts, By Segment 1, 2024-2033
6.4.5.3. Historic Market Data & Future Forecasts, By Segment 2, 2024-2033

6.4.6. Japan
6.4.6.1. Historic Market Data & Future Forecasts, 2024-2033
6.4.6.2. Historic Market Data & Future Forecasts, By Segment 1, 2024-2033
6.4.6.3. Historic Market Data & Future Forecasts, By Segment 2, 2024-2033

6.4.7. South Korea
6.4.7.1. Historic Market Data & Future Forecasts, 2024-2033
6.4.7.2. Historic Market Data & Future Forecasts, By Segment 1, 2024-2033
6.4.7.3. Historic Market Data & Future Forecasts, By Segment 2, 2024-2033

6.5. Latin America
6.5.1. Historic Market Data & Future Forecasts, 2024-2033
6.5.2. Historic Market Data & Future Forecasts, By Segment 1, 2024-2033
6.5.3. Historic Market Data & Future Forecasts, By Segment 2, 2024-2033

6.5.4. Brazil
6.5.4.1. Historic Market Data & Future Forecasts, 2024-2033
6.5.4.2. Historic Market Data & Future Forecasts, By Segment 1, 2024-2033
6.5.4.3. Historic Market Data & Future Forecasts, By Segment 2, 2024-2033

6.5.5. Mexico
6.5.5.1. Historic Market Data & Future Forecasts, 2024-2033
6.5.5.2. Historic Market Data & Future Forecasts, By Segment 1, 2024-2033
6.5.5.3. Historic Market Data & Future Forecasts, By Segment 2, 2024-2033

6.6. Middle East & Africa
6.6.1. Historic Market Data & Future Forecasts, 2024-2033
6.6.2. Historic Market Data & Future Forecasts, By Segment 1, 2024-2033
6.6.3. Historic Market Data & Future Forecasts, By Segment 2, 2024-2033

6.6.4. UAE
6.6.4.1. Historic Market Data & Future Forecasts, 2024-2033
6.6.4.2. Historic Market Data & Future Forecasts, By Segment 1, 2024-2033
6.6.4.3. Historic Market Data & Future Forecasts, By Segment 2, 2024-2033

6.6.5. Saudi Arabia
6.6.5.1. Historic Market Data & Future Forecasts, 2024-2033
6.6.5.2. Historic Market Data & Future Forecasts, By Segment 1, 2024-2033
6.6.5.3. Historic Market Data & Future Forecasts, By Segment 2, 2024-2033

6.6.6. South Africa
6.6.6.1. Historic Market Data & Future Forecasts, 2024-2033
6.6.6.2. Historic Market Data & Future Forecasts, By Segment 1, 2024-2033
6.6.6.3. Historic Market Data & Future Forecasts, By Segment 2, 2024-2033

Chapter 7. Competitive Landscape

7.1. Competitive Heatmap Analysis, 2023
7.2. Competitive Product Analysis

7.3. Company 1
7.3.1. Company Description
7.3.2. Financial Highlights
7.3.3. Product Portfolio
7.3.4. Strategic Initiatives

7.4. Company 2
7.4.1. Company Description
7.4.2. Financial Highlights
7.4.3. Product Portfolio
7.4.4. Strategic Initiatives

7.5. Company 3
7.5.1. Company Description
7.5.2. Financial Highlights
7.5.3. Product Portfolio
7.5.4. Strategic Initiatives

7.6. Company 4
7.6.1. Company Description
7.6.2. Financial Highlights
7.6.3. Product Portfolio
7.6.4. Strategic Initiatives

7.7. Company 5
7.7.1. Company Description
7.7.2. Financial Highlights
7.7.3. Product Portfolio
7.7.4. Strategic Initiatives

7.8. Company 6
7.8.1. Company Description
7.8.2. Financial Highlights
7.8.3. Product Portfolio
7.8.4. Strategic Initiatives

7.9. Company 7
7.9.1. Company Description
7.9.2. Financial Highlights
7.9.3. Product Portfolio
7.9.4. Strategic Initiatives

7.10. Company 8
7.10.1. Company Description
7.10.2. Financial Highlights
7.10.3. Product Portfolio
7.10.4. Strategic Initiatives

7.11. Company 9
7.11.1. Company Description
7.11.2. Financial Highlights
7.11.3. Product Portfolio
7.11.4. Strategic Initiatives

7.12. Company 10
7.12.1. Company Description
7.12.2. Financial Highlights
7.12.3. Product Portfolio
7.12.4. Strategic Initiatives

Research Methodology

Frequently Asked Questions About This Report

Choose License Type

$3,240
$3,780
$4,410

Our salient features

Best Solution

We will assist you in comprehending the value propositions of various reports across multiple domains and recommend the optimal solution to meet your research requirements.

Customized Research

Our team of analysts and consultants provide assistance for customized research requirements

Max ROI

Guaranteed maximum assistance to help you get your reports at the optimum prices, thereby ensuring maximum returns on investment.

24/7 Support

24X7 availability to help you through the buying process as well as answer any of your doubts.

Get a free sample report

This free sample study provides a comprehensive overview of the report, including an executive summary, market segments, complete analysis, country-level analysis, and more.

Our Clients

We've Received Your Request

We Thank You for filling out your requirements. Our sales team will get in touch with you shortly.