North America Industrial Silica Sand Market Size, Share, Growth, Trends, Statistics Analysis Report and By Segment Forecasts 2024 to 2033

Market Overview

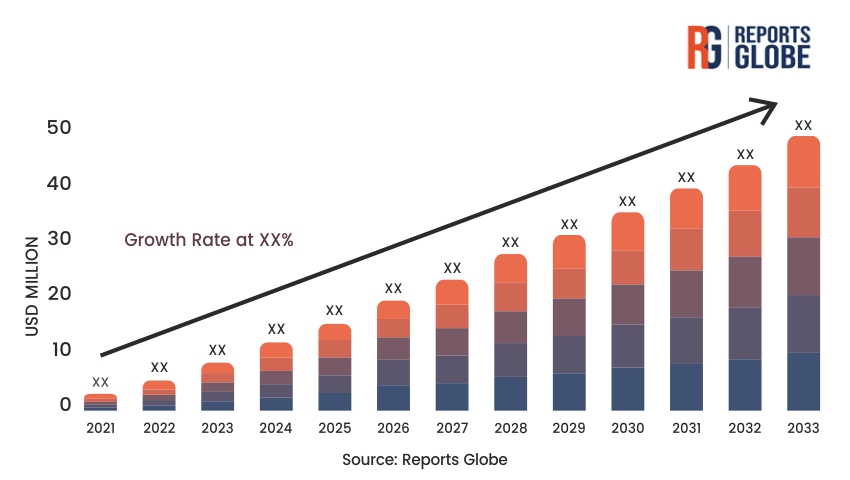
The North American industrial silica sand market has experienced steady growth in recent years, driven by increasing demand from key end-use industries such as oil and gas, foundry, construction, and glassmaking. Silica sand, also known as industrial sand or quartz sand, is a crucial raw material with a wide range of applications due to its high silica content, durability, and chemical inertness. The market’s expansion is attributed to the robust growth of the hydraulic fracturing (fracking) industry, infrastructure development, and technological advancements in glass and foundry production processes. The United States dominates the North American market, with significant silica sand reserves and a well-established mining and processing infrastructure. Canada and Mexico are also notable contributors to the regional market, with increasing exploration and production activities in their respective oil and gas sectors.
Key Takeaways of the Market

  • The North American industrial silica sand market is expected to maintain steady growth, driven by demand from the oil and gas, construction, and glassmaking industries.
  • The hydraulic fracturing (fracking) industry is a key driver for silica sand demand, with the United States being the largest consumer in the region.
  • Infrastructure development and urbanization projects are fueling the demand for silica sand in the construction sector.
  • Technological advancements in glassmaking and foundry processes are creating new opportunities for high-quality silica sand.
  • Environmental concerns and regulatory pressures regarding silica dust exposure are compelling market players to adopt sustainable mining practices and invest in dust control technologies.

Market Driver

The primary driver for the North American industrial silica sand market is the growing demand from the oil and gas industry, particularly in the hydraulic fracturing (fracking) sector. Silica sand is a key proppant used in the fracking process to enhance oil and gas recovery from unconventional reservoirs such as shale formations. The United States has been at the forefront of the shale revolution, with extensive shale reserves and advanced fracking technologies. The increasing number of fracking wells and the rising demand for proppants have significantly contributed to the growth of the silica sand market. Moreover, the recovery of oil prices and the focus on energy independence have further boosted exploration and production activities, thereby driving the demand for silica sand in the region.

Market Restraint

One of the major restraints for the North American industrial silica sand market is the stringent environmental regulations and health concerns associated with silica dust exposure. Prolonged inhalation of respirable crystalline silica (RCS) can lead to severe health issues such as silicosis, lung cancer, and other respiratory diseases. Regulatory bodies, such as the Occupational Safety and Health Administration (OSHA) in the United States, have implemented strict permissible exposure limits (PELs) for RCS in the workplace. Compliance with these regulations requires significant investments in dust control technologies, air quality monitoring, and personal protective equipment (PPE), which can increase operational costs for silica sand producers. Furthermore, local communities and environmental groups have raised concerns about the ecological impact of silica sand mining, including land disturbance, water contamination, and biodiversity loss, leading to increased public scrutiny and potential project delays or cancellations.

Market Opportunity

The North American industrial silica sand market presents several opportunities for growth and innovation. One notable opportunity lies in the development of high-quality silica sand products for specialty applications, such as ultra-clear glass, solar panels, and advanced ceramics. These high-value applications require silica sand with specific properties, such as high purity, consistent grain size, and low iron content. By investing in advanced processing technologies and quality control measures, silica sand producers can cater to these niche markets and capture premium pricing. Another opportunity exists in the adoption of sustainable mining practices and the development of eco-friendly proppants. As environmental concerns gain prominence, silica sand producers who demonstrate a commitment to responsible mining, land reclamation, and water conservation can differentiate themselves in the market and attract environmentally conscious customers. Additionally, the increasing demand for lightweight and durable materials in the construction and automotive industries presents an opportunity for silica sand-based products, such as high-strength concrete and glass-reinforced plastics.

Market Segment Analysis

  1. Oil and Gas Segment: The oil and gas segment is the largest consumer of industrial silica sand in North America, primarily driven by the hydraulic fracturing (fracking) industry. Silica sand is used as a proppant in the fracking process to keep the fractures open and enhance hydrocarbon flow. The segment’s growth is closely tied to the expansion of shale oil and gas production in the United States, particularly in regions such as the Permian Basin, Eagle Ford, and Marcellus Shale. The demand for silica sand proppants varies with the level of fracking activity, which is influenced by factors such as oil and gas prices, production costs, and regulatory policies. The segment is characterized by a high volume of silica sand consumption, with a focus on product quality, consistency, and delivery reliability. Silica sand producers serving the oil and gas segment often have long-term supply contracts and strategic partnerships with exploration and production companies to ensure a stable demand and optimized logistics.
  2. Glassmaking Segment: The glassmaking segment is another significant consumer of industrial silica sand in North America. Silica sand is the primary raw material used in the production of various types of glass, including flat glass (windows and automotive glass), container glass (bottles and jars), and specialty glass (optical and solar glass). The segment’s demand for silica sand is driven by factors such as construction activity, automotive production, and consumer packaging trends. High-quality silica sand with low iron content and consistent grain size is essential for producing clear and durable glass products. Glassmakers often have stringent specifications for silica sand quality and work closely with suppliers to ensure consistent and reliable supply. The segment also presents opportunities for value-added silica sand products, such as ultra-clear glass sand and solar glass sand, which command premium prices due to their specific properties and end-use applications. Glassmakers are increasingly focused on sustainability and reducing their environmental footprint, creating a demand for silica sand suppliers who can provide eco-friendly solutions and support recycling efforts.

Regional Analysis

The North American industrial silica sand market is dominated by the United States, which accounts for the largest share of production and consumption in the region. The United States has vast silica sand reserves, primarily located in states such as Wisconsin, Illinois, Texas, and Minnesota. The country’s well-developed mining and processing infrastructure, coupled with its strong logistics network, has enabled efficient supply to key end-use industries. The United States is also the global leader in hydraulic fracturing, driving significant demand for silica sand proppants in the oil and gas sector. Additionally, the presence of major glassmaking and foundry industries in the United States contributes to the steady demand for industrial silica sand.

Canada and Mexico are the other notable markets in the North American region. Canada has significant silica sand deposits and a growing oil and gas industry, particularly in the Western Canadian Sedimentary Basin. The country’s silica sand producers cater to both domestic and export markets, with a focus on high-quality products for specialized applications. Mexico’s industrial silica sand market is primarily driven by the construction and glassmaking sectors, with increasing demand from infrastructure development and automotive manufacturing. The country’s proximity to the United States has facilitated trade and investment in the silica sand industry.

The North American industrial silica sand market benefits from the region’s advanced transportation infrastructure, including a network of highways, railroads, and waterways. This infrastructure enables efficient distribution of silica sand from mining sites to processing facilities and end-use locations. The region also has a mature regulatory framework governing silica sand mining and processing, with a focus on environmental protection, worker safety, and community engagement. However, the market also faces challenges such as increasing public scrutiny over the environmental impact of mining activities and the need for sustainable practices to mitigate carbon footprint and preserve natural habitats.

Competitive Analysis

The North American industrial silica sand market is characterized by the presence of several large-scale producers and numerous regional players. The market is moderately consolidated, with the top players accounting for a significant share of production and sales. Key companies in the market include U.S. Silica, Covia Holdings Corporation, Hi-Crush Inc., Badger Mining Corporation, and Emerge Energy Services LP.

These leading players have established mining and processing facilities, extensive distribution networks, and strong customer relationships in the region. They compete based on factors such as product quality, consistency, delivery reliability, technical support, and pricing. Many of these companies have vertically integrated operations, encompassing mining, processing, and logistics, which allows them to optimize costs and ensure a steady supply to customers.

The market also features regional players who cater to specific end-use industries or geographic markets. These companies often focus on niche products or specialized services to differentiate themselves from larger competitors. Some regional players have formed strategic partnerships or joint ventures with major producers to access new markets or expand their product offerings.

The competitive landscape is influenced by factors such as the level of fracking activity in the oil and gas sector, the demand from construction and glassmaking industries, and the overall economic growth in the region. Companies are investing in advanced processing technologies, quality control measures, and research and development to enhance product performance and meet evolving customer requirements. They are also focusing on sustainable mining practices, dust control technologies, and community engagement initiatives to address environmental concerns and maintain a social license to operate.

Mergers, acquisitions, and strategic collaborations are common in the North American industrial silica sand market as companies seek to expand their market presence, access new reserves, or diversify their product portfolio. The market is expected to witness further consolidation as players strive to achieve economies of scale and improve their competitiveness in the face of changing market dynamics and regulatory pressures.

Key Industry Developments

  • U.S. Silica Holdings, Inc. acquired EP Minerals, a leading producer of engineered diatomaceous earth and perlite products, for $750 million to diversify its product portfolio and expand its presence in high-value industrial markets.
  • Covia Holdings Corporation completed the merger of Unimin Corporation and Fairmount Santrol Holdings Inc., creating a leading provider of minerals and materials solutions for the industrial and energy markets in North America.
  • Hi-Crush Inc. launched a new proprietary mobile frac sand delivery system, called “PropStream,” which enables efficient and flexible delivery of proppants to well sites, reducing logistics costs and improving operational efficiency.
  • Badger Mining Corporation opened a new state-of-the-art sand processing facility in Wisconsin, increasing its production capacity and product offerings for the oil and gas and industrial markets.
  • Emerge Energy Services LP filed for Chapter 11 bankruptcy protection due to challenging market conditions and heavy debt load, highlighting the financial pressures faced by some players in the industry.

Future Outlook

The North American industrial silica sand market is expected to maintain steady growth in the coming years, driven by the resilient demand from key end-use industries. The oil and gas sector, particularly the hydraulic fracturing industry, will continue to be a significant consumer of silica sand proppants. While the market may experience short-term fluctuations due to volatility in oil prices and changes in fracking activity levels, the long-term outlook remains positive, supported by the vast shale reserves and the region’s focus on energy independence.

The construction industry’s recovery and ongoing infrastructure development projects will fuel the demand for silica sand in the production of glass, cement, and other building materials. The increasing emphasis on sustainable construction practices and green building standards may create opportunities for silica sand producers who can offer eco-friendly solutions and support the development of energy-efficient materials.

Technological advancements in glassmaking, including the demand for ultra-clear glass and solar panels, will drive the need for high-quality silica sand with specific properties. Silica sand producers who can consistently deliver products meeting these stringent requirements will be well-positioned to capture growth opportunities in these specialty markets.

The market will also witness a growing focus on environmental sustainability and responsible mining practices. Companies will need to invest in advanced dust control technologies, air quality monitoring systems, and land reclamation initiatives to comply with regulatory requirements and address community concerns. Collaborative efforts between industry players, government agencies, and local stakeholders will be crucial in developing sustainable solutions and maintaining the social license to operate.

The North American industrial silica sand market will continue to be shaped by factors such as economic growth, infrastructure spending, energy policies, and environmental regulations. Companies that can adapt to changing market dynamics, invest in innovation, and maintain a strong focus on customer service and product quality will be best positioned to succeed in this competitive landscape.

Market Segmentation

By product type:

  • Frac Sand
  • Industrial Sand
  • Foundry Sand
  • Glass Sand
  • Others (Filter Sand, Recreation Sand, etc.)

By end-use industry:

  • Oil and Gas
  • Building and Construction
  • Foundry
  • Glass Manufacturing
  • Chemical Production
  • Others (Agriculture, Water Filtration, etc.)

By particle size:

  • 20-40 Mesh
  • 40-70 Mesh
  • 70-140 Mesh
  • Above 140 Mesh

By country:

  • United States
  • Canada
  • Mexico

By region:

  • North-East
  • Midwest
  • South
  • West

Table of Contents

Chapter 1. Research Methodology & Data Sources

1.1. Data Analysis Models
1.2. Research Scope & Assumptions
1.3. List of Primary & Secondary Data Sources 

Chapter 2. Executive Summary

2.1. Market Overview
2.2. Segment Overview
2.3. Market Size and Estimates, 2021 to 2033
2.4. Market Size and Estimates, By Segments, 2021 to 2033

Chapter 3. Industry Analysis

3.1. Market Segmentation
3.2. Market Definitions and Assumptions
3.3. Supply chain analysis
3.4. Porter’s five forces analysis
3.5. PEST analysis
3.6. Market Dynamics
3.6.1. Market Driver Analysis
3.6.2. Market Restraint analysis
3.6.3. Market Opportunity Analysis
3.7. Competitive Positioning Analysis, 2023
3.8. Key Player Ranking, 2023

Chapter 4. Market Segment Analysis- Segment 1

4.1.1. Historic Market Data & Future Forecasts, 2024-2033
4.1.2. Historic Market Data & Future Forecasts by Region, 2024-2033

Chapter 5. Market Segment Analysis- Segment 2

5.1.1. Historic Market Data & Future Forecasts, 2024-2033
5.1.2. Historic Market Data & Future Forecasts by Region, 2024-2033

Chapter 6. Regional or Country Market Insights

** Reports focusing on a particular region or country will contain data unique to that region or country **

6.1. Global Market Data & Future Forecasts, By Region 2024-2033

6.2. North America
6.2.1. Historic Market Data & Future Forecasts, 2024-2033
6.2.2. Historic Market Data & Future Forecasts, By Segment 1, 2024-2033
6.2.3. Historic Market Data & Future Forecasts, By Segment 2, 2024-2033

6.2.4. U.S.
6.2.4.1. Historic Market Data & Future Forecasts, 2024-2033
6.2.4.2. Historic Market Data & Future Forecasts, By Segment 1, 2024-2033
6.2.4.3. Historic Market Data & Future Forecasts, By Segment 2, 2024-2033

6.2.5. Canada
6.2.5.1. Historic Market Data & Future Forecasts, 2024-2033
6.2.5.2. Historic Market Data & Future Forecasts, By Segment 1, 2024-2033
6.2.5.3. Historic Market Data & Future Forecasts, By Segment 2, 2024-2033

6.3. Europe
6.3.1. Historic Market Data & Future Forecasts, 2024-2033
6.3.2. Historic Market Data & Future Forecasts, By Segment 1, 2024-2033
6.3.3. Historic Market Data & Future Forecasts, By Segment 2, 2024-2033

6.3.4. UK
6.3.4.1. Historic Market Data & Future Forecasts, 2024-2033
6.3.4.2. Historic Market Data & Future Forecasts, By Segment 1, 2024-2033
6.3.4.3. Historic Market Data & Future Forecasts, By Segment 2, 2024-2033

6.3.5. Germany
6.3.5.1. Historic Market Data & Future Forecasts, 2024-2033
6.3.5.2. Historic Market Data & Future Forecasts, By Segment 1, 2024-2033
6.3.5.3. Historic Market Data & Future Forecasts, By Segment 2, 2024-2033

6.3.6. France
6.3.6.1. Historic Market Data & Future Forecasts, 2024-2033
6.3.6.2. Historic Market Data & Future Forecasts, By Segment 1, 2024-2033
6.3.6.3. Historic Market Data & Future Forecasts, By Segment 2, 2024-2033

6.4. Asia Pacific
6.4.1. Historic Market Data & Future Forecasts, 2024-2033
6.4.2. Historic Market Data & Future Forecasts, By Segment 1, 2024-2033
6.4.3. Historic Market Data & Future Forecasts, By Segment 2, 2024-2033

6.4.4. China
6.4.4.1. Historic Market Data & Future Forecasts, 2024-2033
6.4.4.2. Historic Market Data & Future Forecasts, By Segment 1, 2024-2033
6.4.4.3. Historic Market Data & Future Forecasts, By Segment 2, 2024-2033

6.4.5. India
6.4.5.1. Historic Market Data & Future Forecasts, 2024-2033
6.4.5.2. Historic Market Data & Future Forecasts, By Segment 1, 2024-2033
6.4.5.3. Historic Market Data & Future Forecasts, By Segment 2, 2024-2033

6.4.6. Japan
6.4.6.1. Historic Market Data & Future Forecasts, 2024-2033
6.4.6.2. Historic Market Data & Future Forecasts, By Segment 1, 2024-2033
6.4.6.3. Historic Market Data & Future Forecasts, By Segment 2, 2024-2033

6.4.7. South Korea
6.4.7.1. Historic Market Data & Future Forecasts, 2024-2033
6.4.7.2. Historic Market Data & Future Forecasts, By Segment 1, 2024-2033
6.4.7.3. Historic Market Data & Future Forecasts, By Segment 2, 2024-2033

6.5. Latin America
6.5.1. Historic Market Data & Future Forecasts, 2024-2033
6.5.2. Historic Market Data & Future Forecasts, By Segment 1, 2024-2033
6.5.3. Historic Market Data & Future Forecasts, By Segment 2, 2024-2033

6.5.4. Brazil
6.5.4.1. Historic Market Data & Future Forecasts, 2024-2033
6.5.4.2. Historic Market Data & Future Forecasts, By Segment 1, 2024-2033
6.5.4.3. Historic Market Data & Future Forecasts, By Segment 2, 2024-2033

6.5.5. Mexico
6.5.5.1. Historic Market Data & Future Forecasts, 2024-2033
6.5.5.2. Historic Market Data & Future Forecasts, By Segment 1, 2024-2033
6.5.5.3. Historic Market Data & Future Forecasts, By Segment 2, 2024-2033

6.6. Middle East & Africa
6.6.1. Historic Market Data & Future Forecasts, 2024-2033
6.6.2. Historic Market Data & Future Forecasts, By Segment 1, 2024-2033
6.6.3. Historic Market Data & Future Forecasts, By Segment 2, 2024-2033

6.6.4. UAE
6.6.4.1. Historic Market Data & Future Forecasts, 2024-2033
6.6.4.2. Historic Market Data & Future Forecasts, By Segment 1, 2024-2033
6.6.4.3. Historic Market Data & Future Forecasts, By Segment 2, 2024-2033

6.6.5. Saudi Arabia
6.6.5.1. Historic Market Data & Future Forecasts, 2024-2033
6.6.5.2. Historic Market Data & Future Forecasts, By Segment 1, 2024-2033
6.6.5.3. Historic Market Data & Future Forecasts, By Segment 2, 2024-2033

6.6.6. South Africa
6.6.6.1. Historic Market Data & Future Forecasts, 2024-2033
6.6.6.2. Historic Market Data & Future Forecasts, By Segment 1, 2024-2033
6.6.6.3. Historic Market Data & Future Forecasts, By Segment 2, 2024-2033

Chapter 7. Competitive Landscape

7.1. Competitive Heatmap Analysis, 2023
7.2. Competitive Product Analysis

7.3. Company 1
7.3.1. Company Description
7.3.2. Financial Highlights
7.3.3. Product Portfolio
7.3.4. Strategic Initiatives

7.4. Company 2
7.4.1. Company Description
7.4.2. Financial Highlights
7.4.3. Product Portfolio
7.4.4. Strategic Initiatives

7.5. Company 3
7.5.1. Company Description
7.5.2. Financial Highlights
7.5.3. Product Portfolio
7.5.4. Strategic Initiatives

7.6. Company 4
7.6.1. Company Description
7.6.2. Financial Highlights
7.6.3. Product Portfolio
7.6.4. Strategic Initiatives

7.7. Company 5
7.7.1. Company Description
7.7.2. Financial Highlights
7.7.3. Product Portfolio
7.7.4. Strategic Initiatives

7.8. Company 6
7.8.1. Company Description
7.8.2. Financial Highlights
7.8.3. Product Portfolio
7.8.4. Strategic Initiatives

7.9. Company 7
7.9.1. Company Description
7.9.2. Financial Highlights
7.9.3. Product Portfolio
7.9.4. Strategic Initiatives

7.10. Company 8
7.10.1. Company Description
7.10.2. Financial Highlights
7.10.3. Product Portfolio
7.10.4. Strategic Initiatives

7.11. Company 9
7.11.1. Company Description
7.11.2. Financial Highlights
7.11.3. Product Portfolio
7.11.4. Strategic Initiatives

7.12. Company 10
7.12.1. Company Description
7.12.2. Financial Highlights
7.12.3. Product Portfolio
7.12.4. Strategic Initiatives

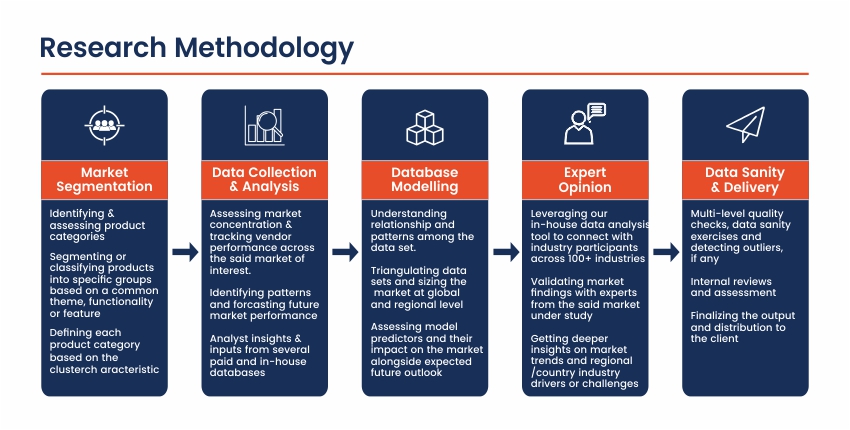
Research Methodology

Frequently Asked Questions About This Report

Choose License Type

$2,430
$2,970
$3,510

Our salient features

Best Solution

We will assist you in comprehending the value propositions of various reports across multiple domains and recommend the optimal solution to meet your research requirements.

Customized Research

Our team of analysts and consultants provide assistance for customized research requirements

Max ROI

Guaranteed maximum assistance to help you get your reports at the optimum prices, thereby ensuring maximum returns on investment.

24/7 Support

24X7 availability to help you through the buying process as well as answer any of your doubts.

Get a free sample report

This free sample study provides a comprehensive overview of the report, including an executive summary, market segments, complete analysis, country-level analysis, and more.

Our Clients

We've Received Your Request

We Thank You for filling out your requirements. Our sales team will get in touch with you shortly.